

Can you front-run markets?
Trading across borders

Once in a while, we do an analysis purely driven by our own curiosity. We don’t look at any existing research that can bias our views and do it for fun instead of novel insights. This is one of them — Hope you enjoy :)
P.S: we might be way off base here and any critique is welcome. In that spirit, we have shared all the data and code, and removed the paywall for this one.
Contrary to popular belief, Sam Bankman-Fried (SBF) was not always scamming customers out of their money. SBF used to work for the prestigious quant-trading firm Jane Street before launching the crypto-trading firm Alameda Research in 2017. The crypto market in 2017 was the Wild West compared to the traditional stock market and was ripe with arbitrage opportunities.
A classic example was the kimchi premium. When Bitcoin was trading at $10K in the U.S. in 2017, it was trading at close to $15K in Korean exchanges due to the high demand for Bitcoin in Korea. So, anyone who could buy Bitcoin in the U.S. and then sell the same in Korea would make a cool 50% profit apparently taking no significant risk. But, the devil is in the details — doing this strategy at scale was difficult since Korean Won is a regulated currency.
Given this constraint, SBF searched for similar opportunities globally and found them in Japan. Bitcoin was trading at only a 15% premium in Japan (when compared to ~50% in Korea), but it was far easier to trade Yen to USD and vice-versa. While we are simplifying the strategy considerably, by doing this, SBF was making a 10% return every day! At its peak, Alameda Research scaled the strategy up to $200 million in capital making an incredible $20 million profit daily.
The interconnectedness between the global financial markets creates arbitrage opportunities. How many times have we seen news reports like the ones below?


Time and again we have seen that whether it’s due to some drastic decision by the Fed to hike rates or a bank collapse like SVB, the ripple effects of what happens in the U.S. markets are reflected in global markets almost instantaneously.
Given that the U.S. stock market is the largest one in the world making up more than 50% of the market value of all global listed equities, it’s almost guaranteed that severe changes to the U.S. market would move other markets.
The million-dollar question here would be, given the time-zone difference, can you ‘front-run’ other markets based on the U.S. market?
To better understand what we are proposing, consider the comparison between the U.S. stock market and the Indian stock market.
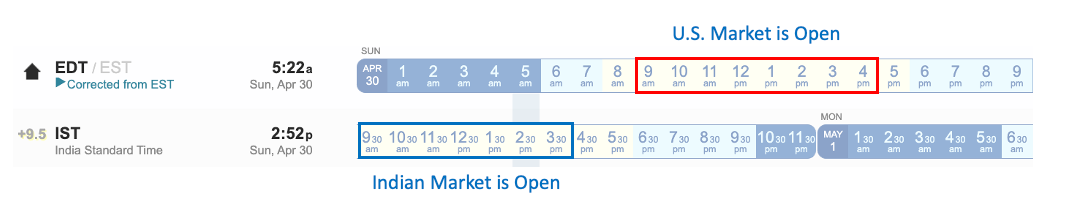
India is 9.5 hours ahead of U.S. time (EST). So the U.S. markets open 2 hours after the Indian markets have closed for the day. It’s unlikely that the Indian markets can have significant effects on the U.S.
But, what about the other way around? Indian markets open only 8 hours after the U.S. market closes — If there is a big positive or negative move in the U.S. stock market, would it be reflected in the Indian markets as well? If yes, can we get in at the market open to generate alpha?
Our analysis period is limited to the last 6 years due to data availability issues for developing markets. But we should have statistical significance given that we have more than 1400 trading days during this time frame.
First, we can check how the markets are correlated with each other on regular trading days. For this, we consider the U.S. market performance on a given day (say D) as the base and see how the other markets have performed on the next day (D+1).
As we can see, there is barely any correlation (a correlation of at least 0.3 is required for any sort of significance) between the U.S. and other markets. This is more or less expected since the majority of market returns are based on what happens in your local markets.
To remove the noise, we have to filter for outlier moves. We only focused on the days when there was a significant move in the U.S. market. Over the past 6 years, there were only 46 days (~3% of the overall trading days) in which the U.S. market has jumped more than 2%. How did the Japanese market (which is the 4th largest trading partner with the U.S.) react to these moves?

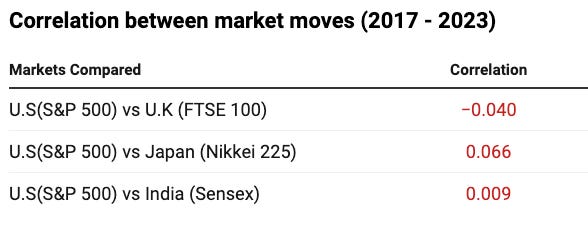
Even after filtering for outlier moves, the correlation stood at only +0.02. Considering the days the U.S. markets fell also did not make any difference with a correlation of only +0.04 with how the Japanese markets reacted the next day.
The Indian stock market also did not have any correlation with how the U.S. market behaved and surprisingly had a weak negative correlation of -0.28.
U.S. vs U.S.
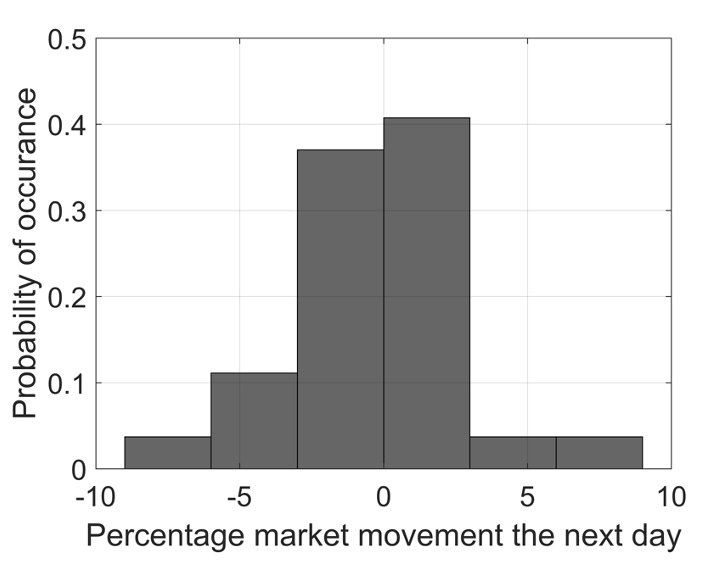
We frequently see investors rushing into the market after it had a big day — Either to buy the dip or follow the trend. But based on the past 6 years of data, there is barely any correlation between how the market performs the next day.
Following is how returns are distributed the day after a move > 2% in the stock market. At a -0.28 correlation coefficient, having a great previous day barely had any effect on the next day’s return (and what it had was a negative effect)
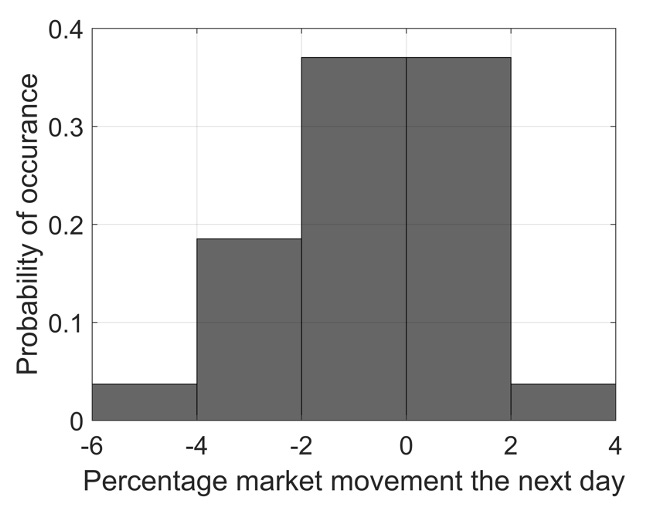
The same applies to the “buy the dip” crowd (at least short-term), where there was no correlation (-0.168) between the stock market dropping more than 2% to the next day's returns.
What does the existing literature say?
As always, there are conflicting results. While we couldn’t find any study exactly replicating our process, the general theme was that the international markets have a good correlation with the U.S. market during the time of crises (2000, 2008, 2020, etc)
Our G-C test results show that the U.S. stock market has substantial influence on the European and Australasian stock markets. U.S. stock returns lead the European and Australasian stock returns (i.e., the past returns of the U.S. stock market can predict the future returns of the European and Australasian stock markets). — International Evidence on Market Linkages after the 2008 Stock Market Crash
Results indicate that return shocks arising in the United States are only fully reflected in equity prices outside of the United States with a lag, consistent with a gradual information diffusion explanation of the predictive power of lagged U.S. returns. — International Stock Return Predictability: What Is the Role of the United States?
Monthly realized moments for stock market returns for the US, the UK, Germany and Japan are employed to assess the linkages holding across moments and markets over the period 1973–2004. The results point to a progressive integration of the four stock markets, leading to increasing comovements in prices, returns, volatilities and correlations. — Comovements in international stock markets
It was unlikely to get a strong enough correlation between the markets to generate consistent alpha. Most of the stock market movement is centered around news and the economic performance of the local country.
But, there’s more than one way to skin a cat. It might be interesting to look at
How cross-listing companies perform (Unilever HQ is listed in both UK and U.S. and its subsidiary is listed in India) — Does the stock performance of the parent company spill over to the subsidiary?
Medium/long-term trends — Currently we considered just the short-term moves. Would the story change if we used monthly returns instead of daily returns?
Closely connected markets — The markets in our analysis are relatively independent of each other. But, what if we analyze closely interconnected and smaller markets like China-Taiwan, Russia-Ukraine, etc?
What do you think would be an interesting way to look at this?
Data for all the major markets and the analysis code — here
Market Sentiment is now fully reader-supported. If you enjoyed this piece, please hit the like button and consider upgrading your subscription to get access to all issues.
(We are offering a 20% discount on our annual subscription)
Disclaimer: We are not financial advisors. Please do your own research before investing.