Does Value Matter?
Looking beyond P/E
Market Sentiment delivers data-backed, actionable insights for long-term investors. Join 52,000 other investors to make sure you don’t miss our next briefing.
Nvidia is an interesting company. In August 2023, it was trading at a P/E (LTM) of 247! The market, at the same time, was trading at a P/E of 24.
So, how did a company that was trading at 10 times the Price to Earnings ratio of the S&P 500 perform over the next two years?
NVDA (as of Jun’25): +211%
S&P 500: +32%
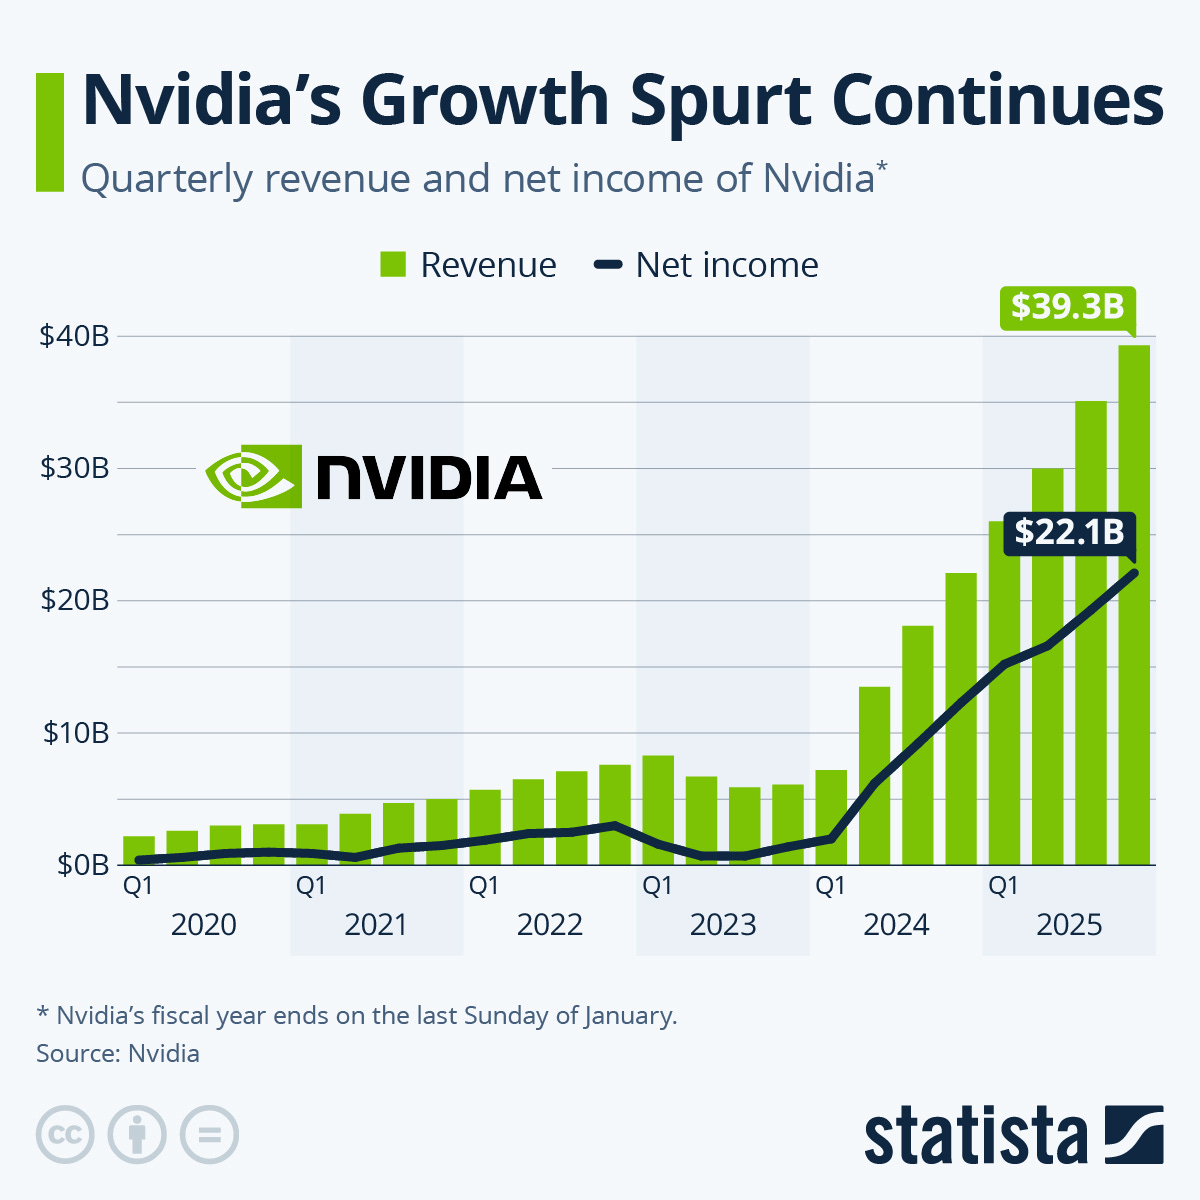
So, why didn’t the company mean-revert? Simple — The revenue and the profits of the company just exploded in the last two years.
In mid-2023, the net income of Nvidia for the trailing 12 months was $10 billion. Just a year later, it was $53 billion. As of the latest quarter, it stands at mind-bending $76 billion.
This massive growth spurt meant that the company is now trading at a more reasonable P/E of 46. Nvidia was one of the elusive cases where the company actually “grew into” its lofty expectations.
But this is a recurring theme among high-growth companies.
Amazon had a 742x PE in 2015. Then its net income exploded from $600 million in 2015 to $66 billion in 2025.
Tesla had an 862x PE in 2020. It’s still trading at 174x, and even after the recent drawdown, you would have doubled the return of the S&P 500.
Broadcom had a 137x PE last year. Now it's up 57%, 5x the performance of the S&P 500!
But let's be clear: for every Amazon or Nvidia that rewrites the rules of valuation, there are dozens of other high-P/E companies that destroy capital.
The critical question now is whether we are missing great opportunities because we become too fixated on the valuation. Do great companies always trade at lofty valuations? And how can we distinguish compounders from hype?
To find out, we pulled the P/E ratio of all companies in the S&P 500 list as of 2015. Let’s dig into how they performed over the next decade:


