


Uber is a remarkable company.
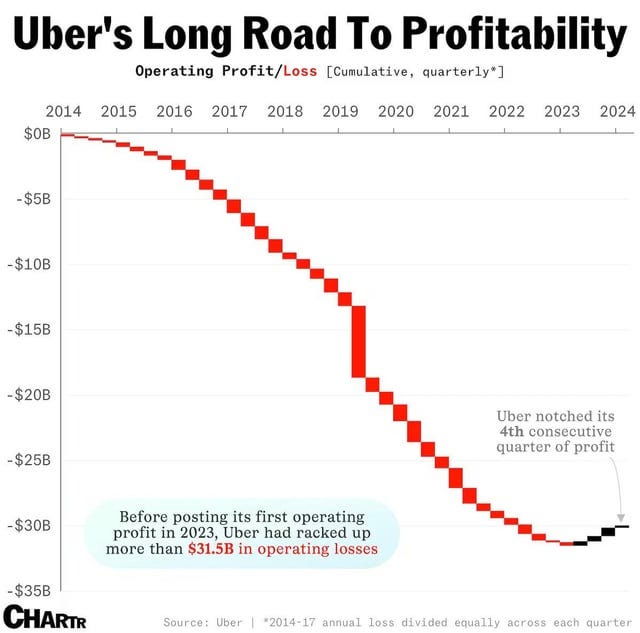
They spent more than $30B over 10 years before turning an operating profit in 2023.
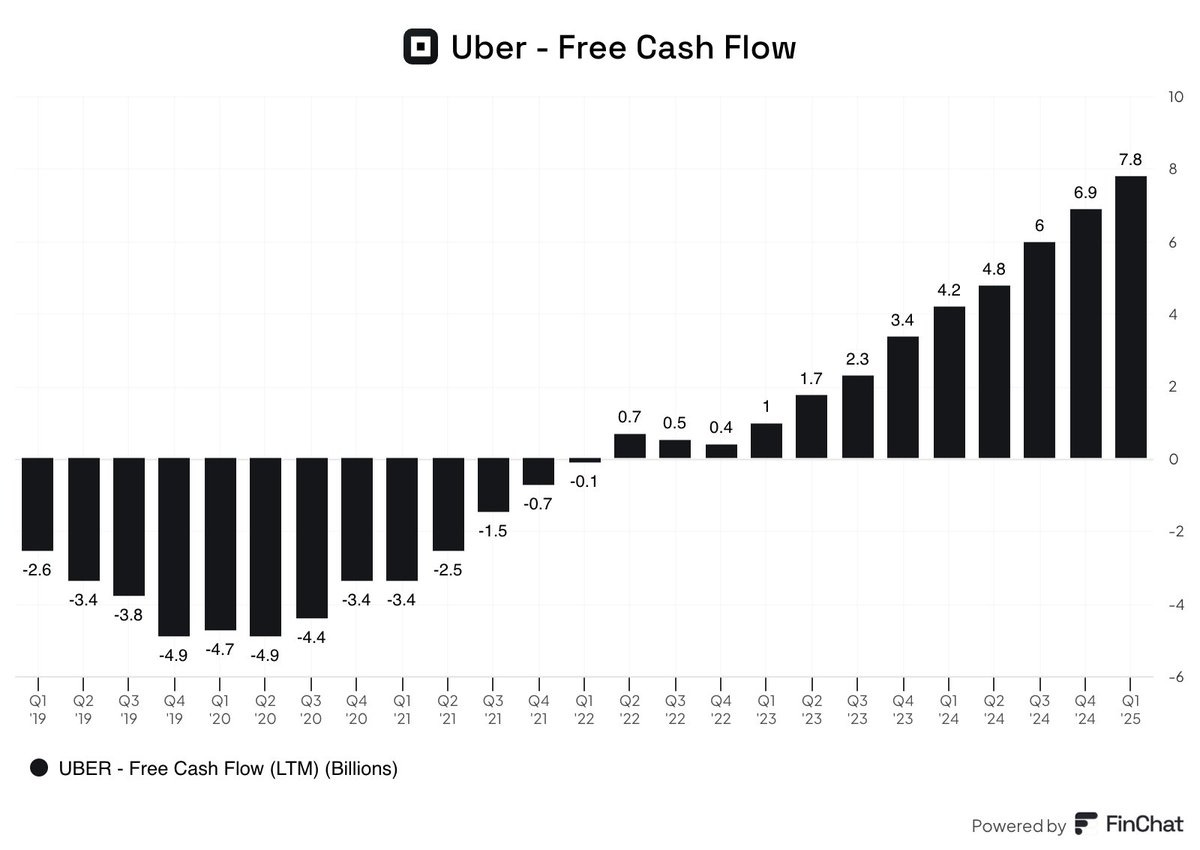
But once it did, the company became a free cash flow machine:
Just as the company was finally hitting its stride, it now faces an existential threat with Autonomous Vehicles. The assumed risk is simple — a company like Waymo can create its own app, sidestepping Uber, and provide the service at a lower cost than Uber can with its human drivers.
But in our view, this is simplistic thinking that doesn't account for why Uber lost all that money during the building phase — ride-hailing is not a global network effect. If you are a marketplace like Amazon, you can reliably service a few states or even the entire country with a massive warehouse once you have built it up. But for Uber, the network you have built in New York isn't useful to someone trying to get a cab in Boston. In the U.S. alone, Uber has spent nearly a decade building 8,000+ micro-markets to match supply with demand.
From an Autonomous Vehicle (AV) developer's perspective, it’s much better (operationally and financially) to plug into the existing Uber ecosystem than to build a system independently (more on this later).
How Uber makes money
To get a sense of how big Uber has become, they have 200mm+ active users and enabled ~13B trips (rides + delivery) in 2025 alone. It also runs a B2B delivery arm, but it accounts for a small fraction of the overall business and adds minimal value.
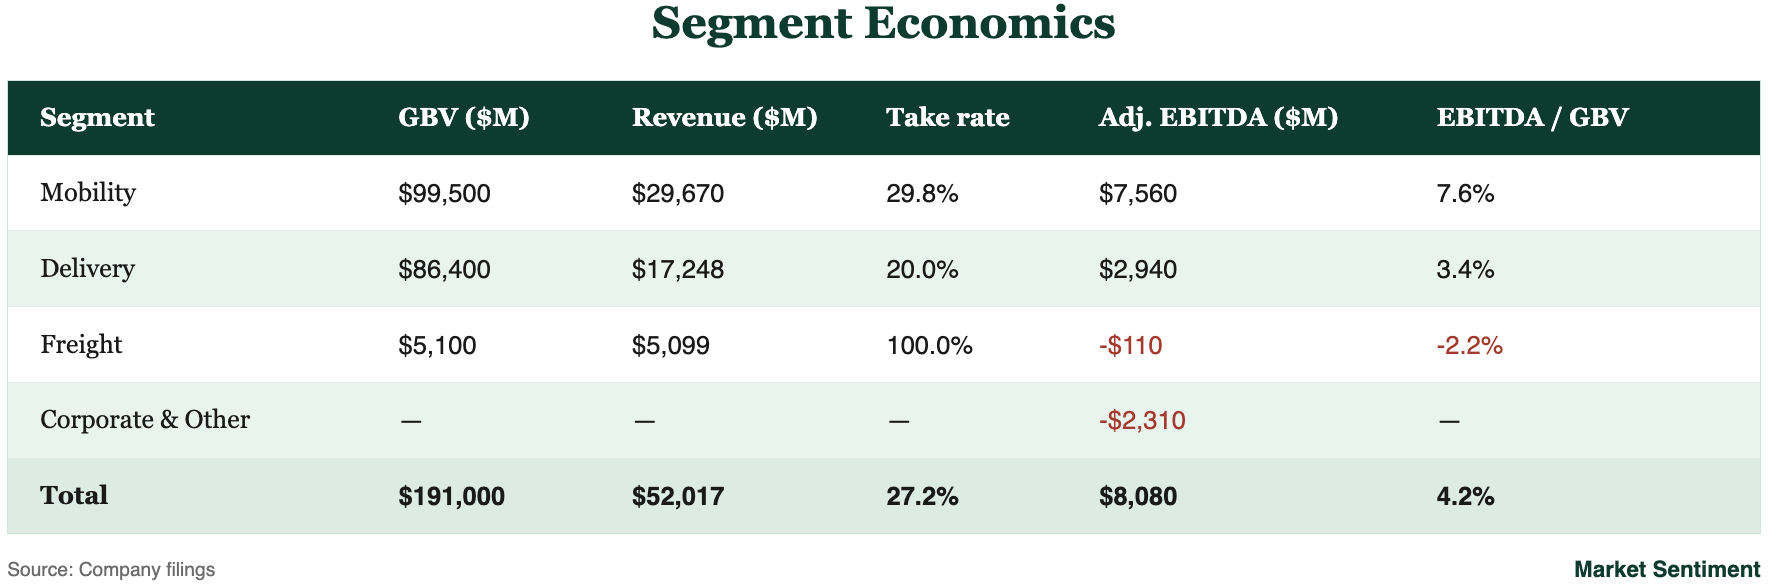
Let’s go from the least to most important segment.
Freight:
Uber Freight is a digital freight brokerage that matches shippers with truck carriers. Rides and freight book differently. In rides, one clearing price is visible to both sides, and Uber takes a disclosed cut. In freight, shippers and carriers negotiate prices separately. Uber contracts as principal, committing a price to each side, so it books the entire gross booking as revenue.
Delivery:
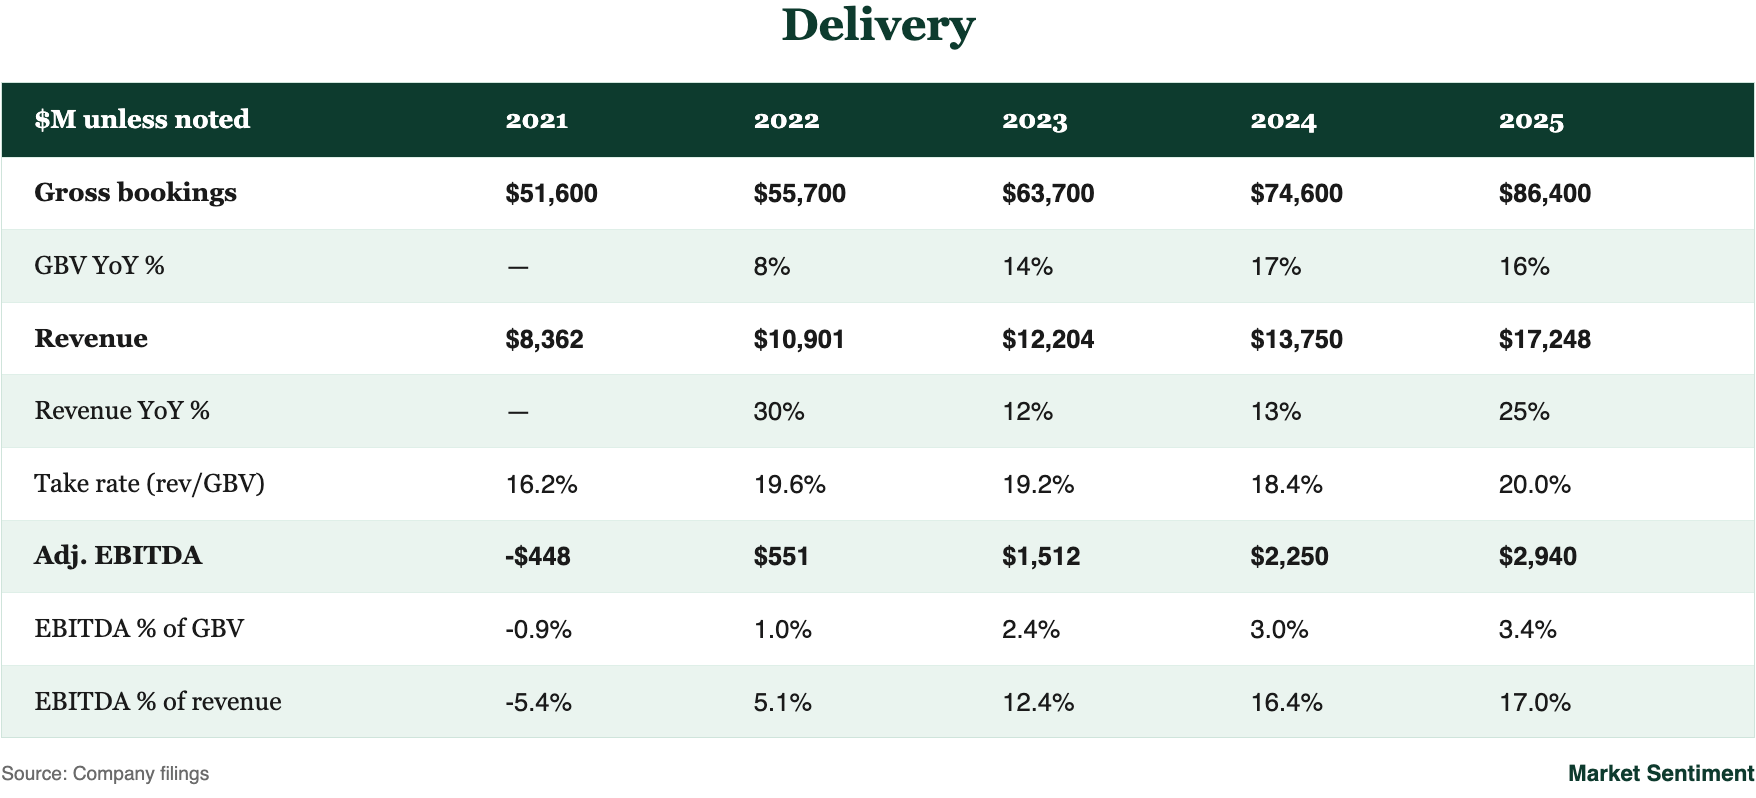
Launched in 2014, it quickly scaled to become the second-largest local delivery business globally ex-China, with $85B in total GBV in 2025, closely trailing the largest player, DoorDash, at $100B. Last month, Uber announced a cash offer for Delivery Hero at an equity value of $14.8 billion. Once the acquisition closes with the necessary approvals, Uber will be the largest delivery business, with ~$135 billion in GBV.
Rides :
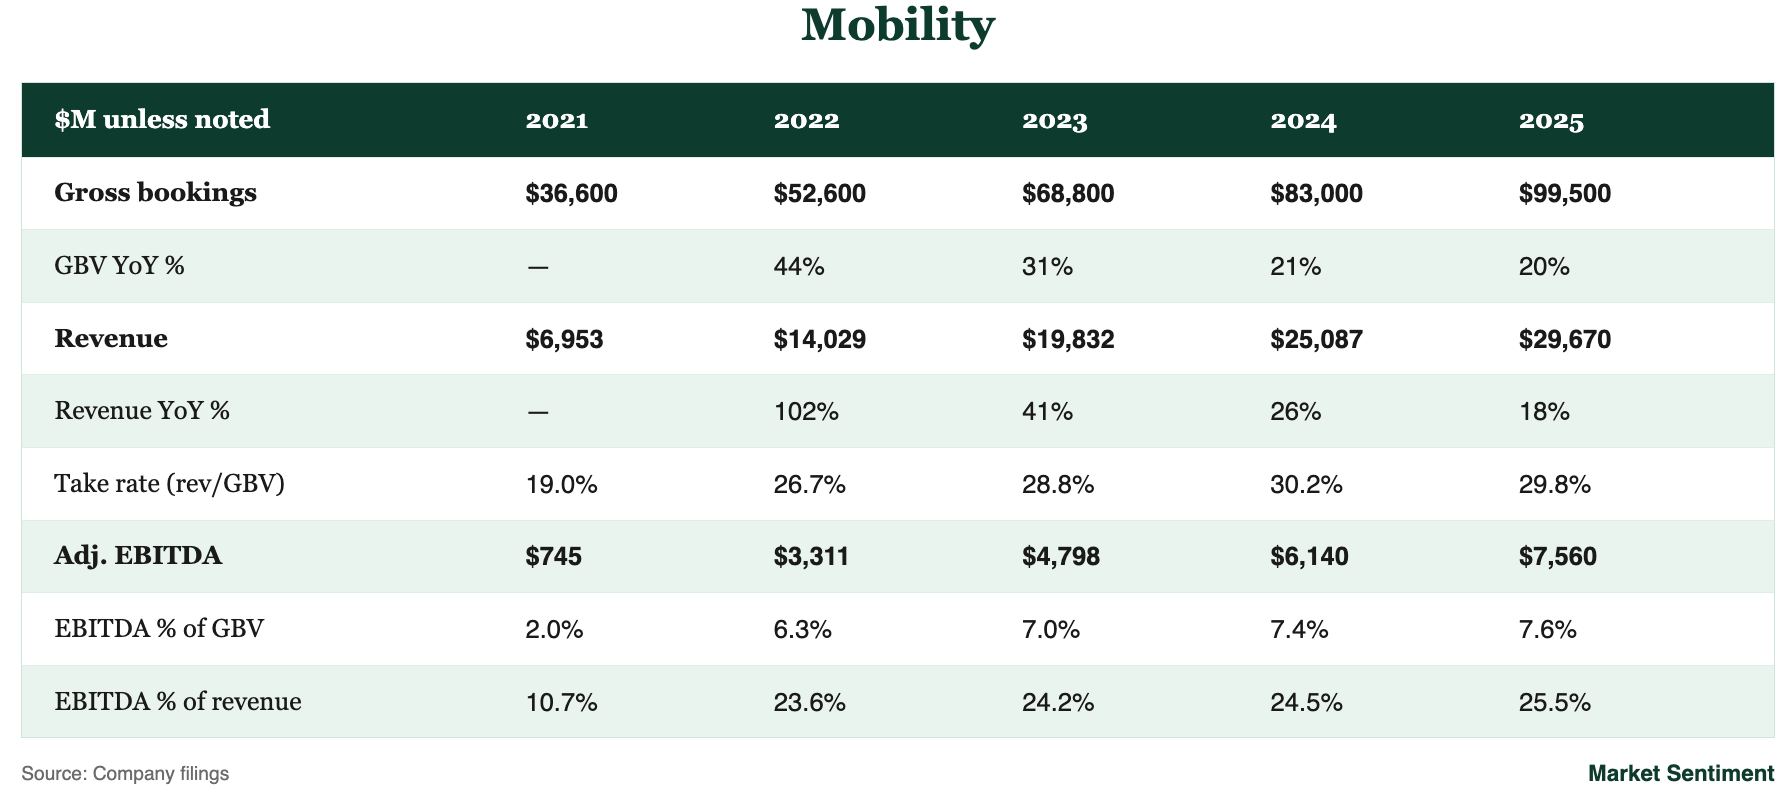
This is Uber’s largest and most profitable business, with $100B in gross bookings value (GBV) and $7.5B in EBITDA in 2025. That profitability shows up in its high take rate of ~30% (revenue retained after driver payouts) and EBITDA of 7.6% of GBV.
Rides GBV has sustained 20% growth for 15 years because Uber keeps innovating on its product; it now operates in 10+ categories, from motos to luxury cars, tailored to local demand. Product innovation, rising demand density, and falling cost per mile for EVs (and eventually AVs) are enabling Uber to expand into suburban markets and increase overall market penetration.
Every Uber ride breaks down into three major costs.
Driver income. The median Uber driver grosses $21.18 an hour, or about $12.50 per trip. That is roughly 70% of the rider fare. After fuel and maintenance, the driver keeps just over 50%.
Insurance. This is the second highest cost. Most US states mandate high-value commercial coverage for rideshare trips, which can run up to 30 times a normal policy. Depending on the state, that is 10% to 30% of the fare. We assume about $2 per trip.
Vehicle operating cost. AAA puts fuel and maintenance at about 25 cents per mile. That works out to roughly 15% of the fare.
Autonomous Vehicles | Landscape, Unit Economics & Adoption
AV Landscape:
AVs face a high bar to launch: a robotaxi must be meaningfully safer than a human driver. But the bar is fixed, unlike GPUs, where performance keeps doubling every few years, helping the likes of NVIDIA stay ahead of the competition. AVs have a finish line on safety and reliability.
More than a dozen companies globally are racing to reach this finish line. Waymo got there first in the US, but several well-funded companies (Zoox, Tesla, etc.) are in advanced trials with launch timelines in the next few years.
Additionally, Mobileye and NVIDIA are building the tech stack to make AVs plug-and-play technology that any automobile company can license or buy. Stellantis and Volkswagen are already taking this route to build AVs.
With so many players racing to build a technology that has a finish line, we believe the AV tech stack will be commoditized.
As the technology gets commoditized, AV hardware is also getting cheaper. Waymo’s Jaguar I-PACE fleet cost $150,000–200,000 per unit, ~$75,000 for the vehicle and ~$125,000 for autonomous hardware. Its replacement, the Zeekr-built Ojai, costs ~$60k, with a ~$38k base vehicle and AV hardware under $20k, using 42% fewer sensors.
AV scaling is supported by declining cost per mile as hardware costs fall and AV companies compete. AV companies’ success now depends on their ability to scale and capture existing demand — and Uber is in the best position to provide that demand.
AV unit economics & utilization:
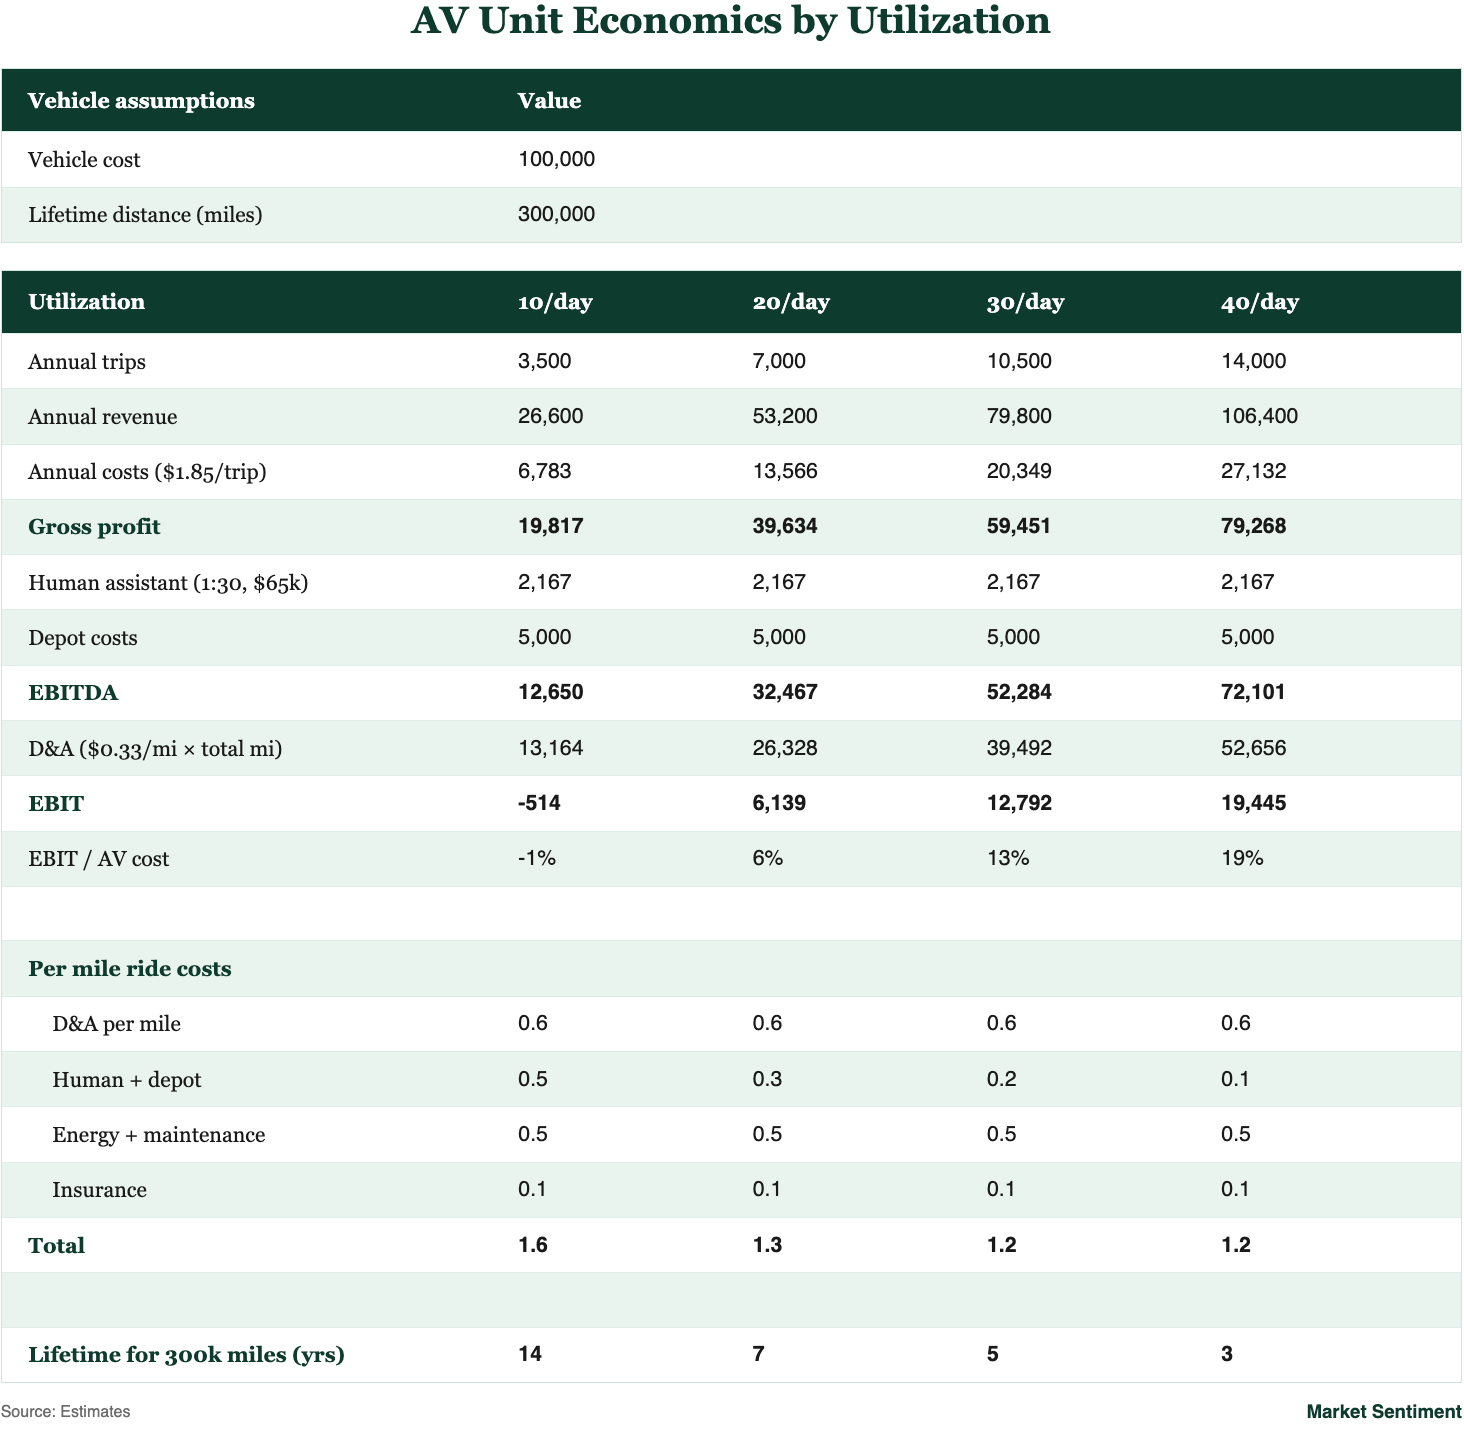
AVs carry a large share of operating costs as fixed overhead — fleet management, maintenance, depreciation, etc. To cover these costs, AVs need high utilization rates. As trips scale from 10 per day to 30 per day, fixed costs can drop from ~30% of revenue to ~10% of revenue, improving AV profit margins.
Currently, AVs break even at ~20+ trips a day. AVs launched on Uber’s network are already operating in this zone of mid-to-high 20s to low 30s trips per vehicle per day.
Uber has reported that AVs on its platform generate 30% more trips than on proprietary apps. Consumer ETAs are also 25% lower on Uber, incentivizing riders to keep coming back (the classic platform effect). The only way to break Uber’s grip on demand is to repeat what Uber itself did: heavy consumer discounts and enough supply to hold ETAs down.
This utilization gap on Uber versus proprietary apps drives Uber’s take rate. 30% higher utilization means 30% more revenue on the same AV fleet. Even after Uber takes a 15% cut, AVs still come out ahead.
Uber's take rate is bounded by the incremental utilization it generates for the AV. When an AV player is fully dependent on Uber, Uber can likely charge a flat ~20–30% take rate.
China offers a preview of the central role aggregators play in driving demand and utilization for AVs. T3 Chuxing, China’s #3 ride-hailing operator, saw its orders from aggregator platforms climb from 61.5% to 77.5% to 85.9% over three years. T3 owns and operates its cars, but demand increasingly flows through aggregators.
AV adoption rate & Market size:
Waymo’s cost per mile in the US is estimated at ~$2 in 2025, comparable to that of human drivers on Uber. By 2030, AV cost per mile is expected to fall below $1 as hardware costs decline and fleet management gains economies of scale.
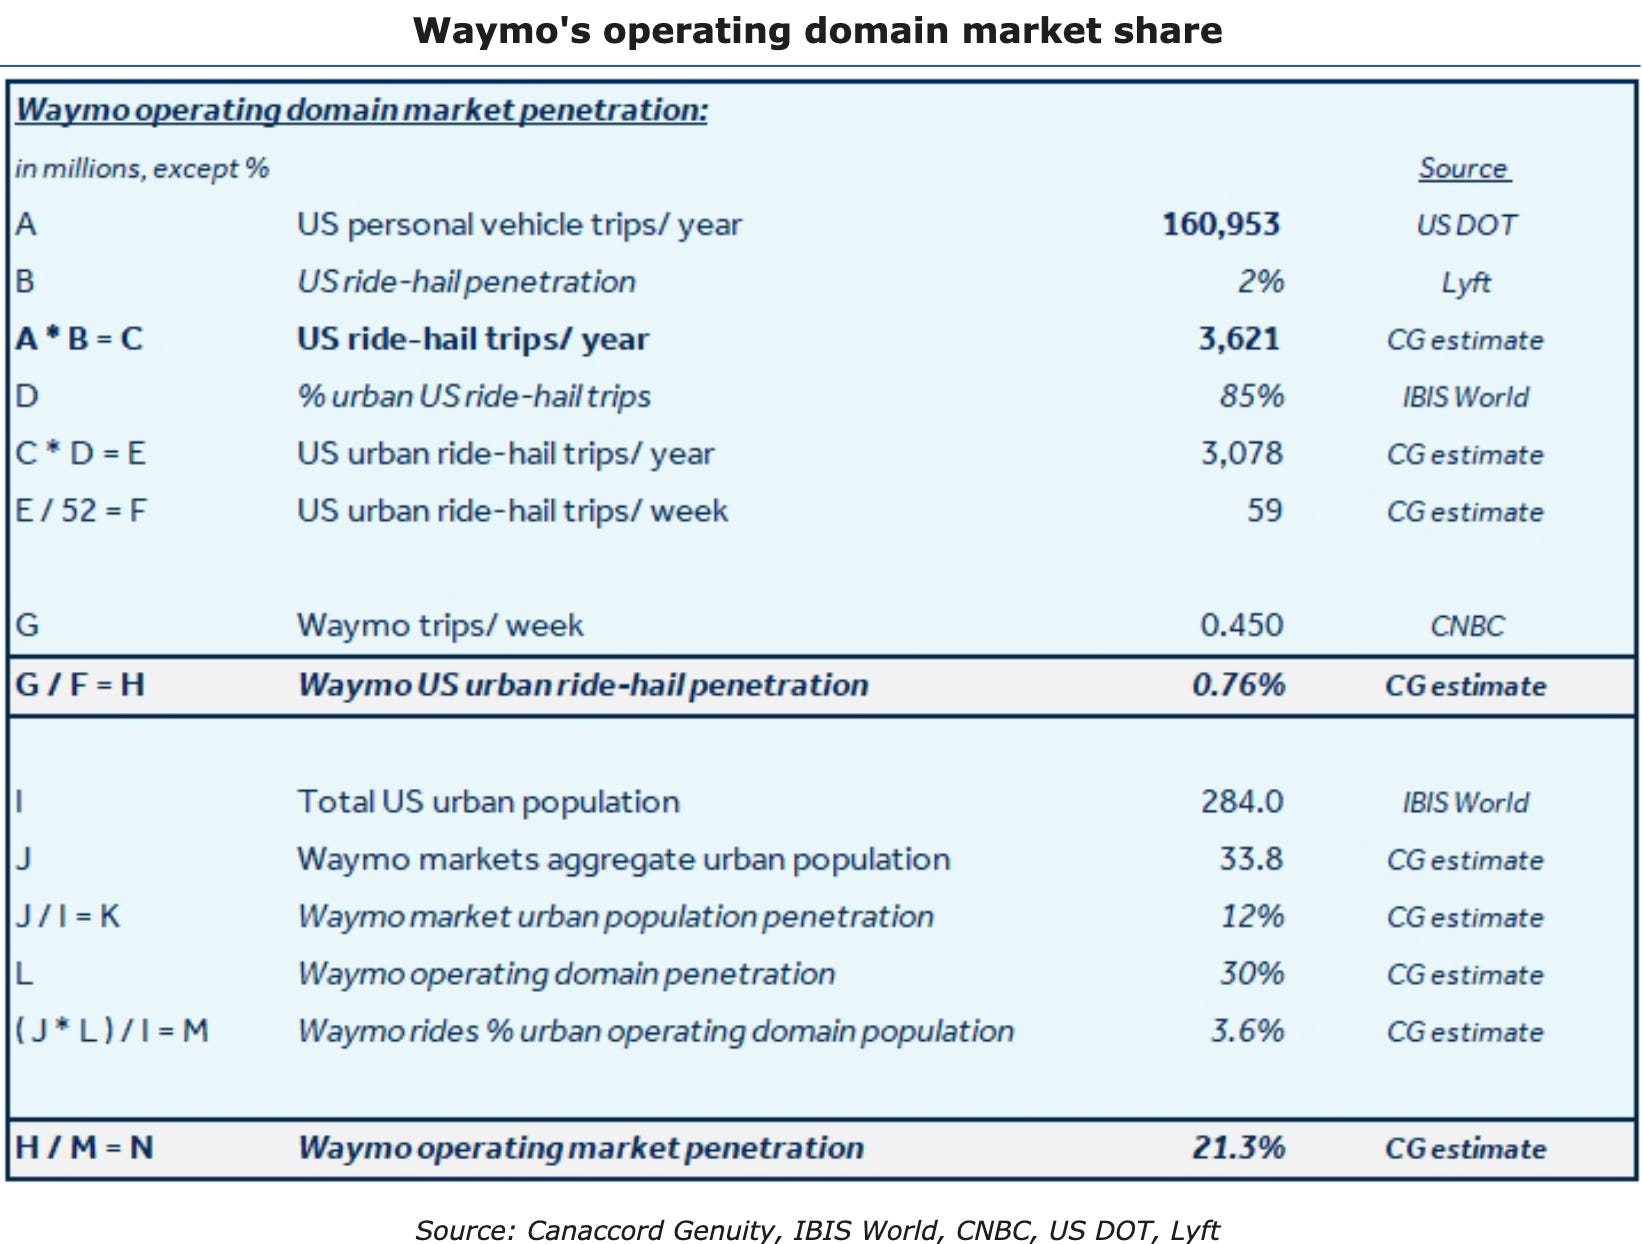
AVs are under 1% of the total cab market today, but within their operating markets they have captured up to a 20% share. Uber has commented on increasing market share in these markets, showing early signs of how AV platforms drive adoption and benefit from it.
As cost per mile declines and AV fleets expand with multiple competing players, AVs are expected to reach ~20% of the US cab market by 2030. With cabs at ~2% market share of personal vehicle miles, lower-cost AVs have room to grow the cab market itself, not just take share within it.
How AV’s will affect Uber’s Effective take rate
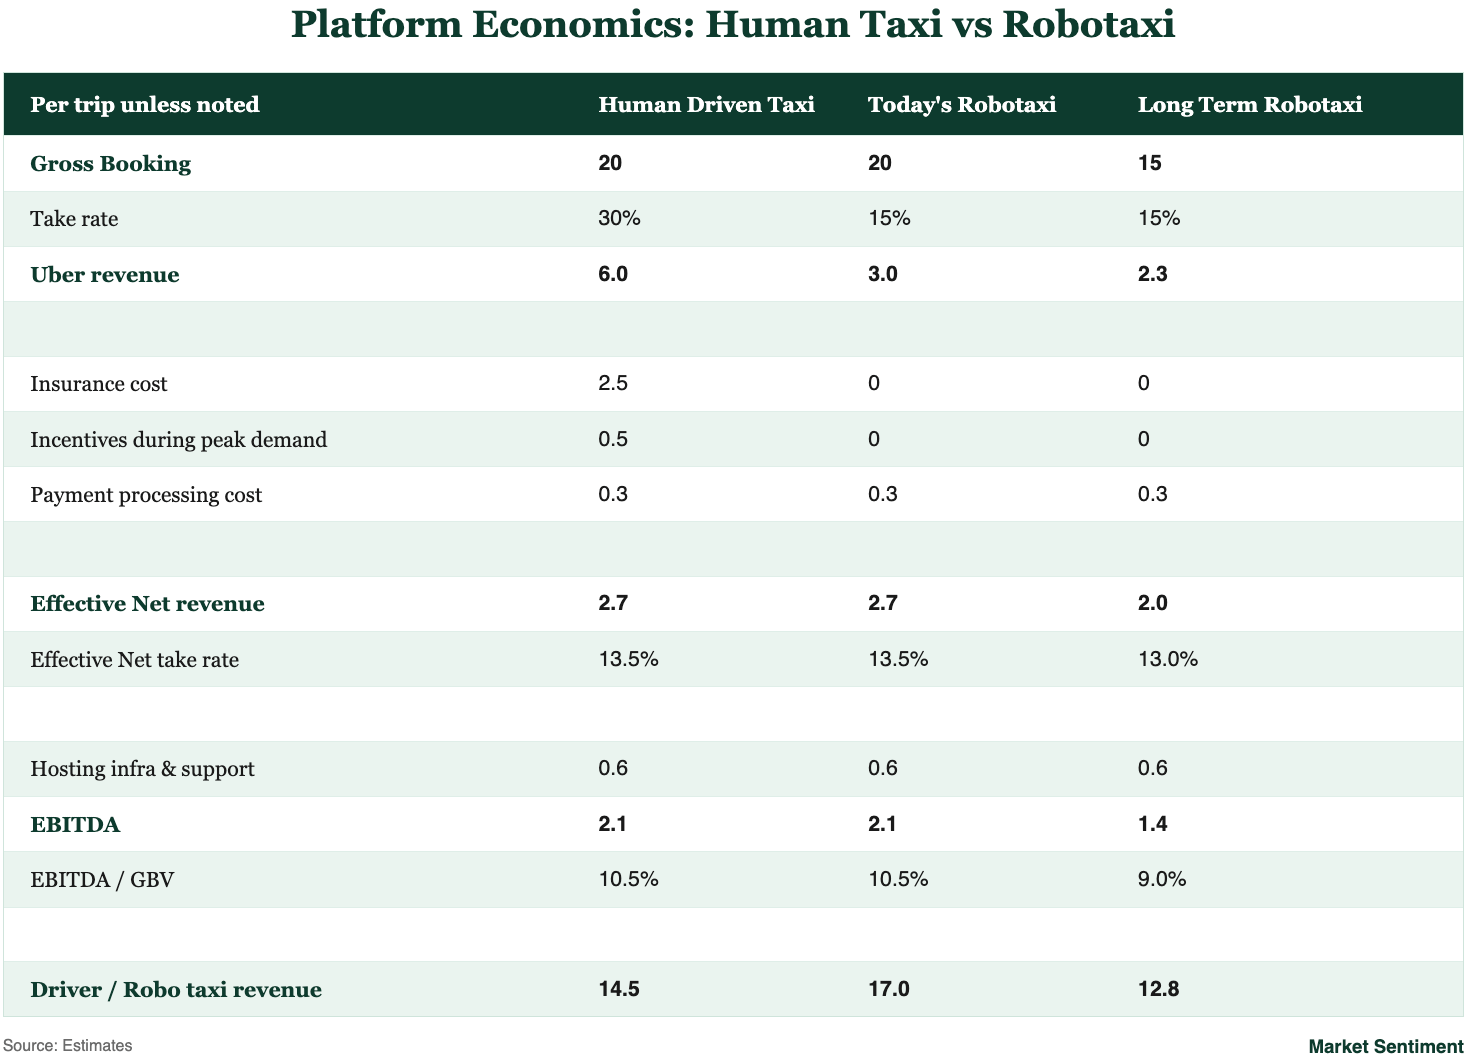
Uber’s rides business today has a headline take rate of ~30%, but its incremental contribution margin is only ~10%. If we look deeper at where the other 20% of take rate goes, most of it falls into insurance and driver incentive programs during peak demand. These two components consume 15% of the headline take rate, leaving Uber’s effective take rate at ~15%.
While AVs might carry a slightly lower headline take rate, Uber doesn’t have to pay peak-demand incentives, and insurance costs will be minimal because AVs prove safer & AV operators are likely to absorb this cost themselves as part of fleet negotiations. Thus, even if Uber accepts a lower take rate of 15% on AV rides, it remains competitive with the effective take rate of human-driven trips.
Uber Model and Market Sentiment Rating
To summarize our findings:
Robotaxis won’t be a winner-take-all market and will most probably end up a split race with multiple players clearing the bar.
From the supplier side, they will look to maximize utilization, and from the consumer side, users will look for the fastest taxis — both of which Uber is perfectly positioned to service.
Directionally, AVs should improve Uber's net take rate. And the deflationary pricing cuts both ways: lower prices expand the market by pulling more users into AV rides.