To Buy or not to Buy: Stock Splits?
I analysed 2,000+ stock splits over the last 3 decades to see if there is an edge
Hello friends! Welcome to Market Sentiment. Join 13,906 other smart investors and traders by subscribing here:
You can check out my best articles here and follow me on Twitter too!
This issue of Market Sentiment is brought to you by… Composer.
At this point, I’d consider myself a Composer power user. Composer is basically algo-trading without Python or Excel. They have dozens of pre-made investing templates — but what's awesome is the ability to edit those templates or build your own strategy from scratch, backtest it, and then invest. It's like Squarespace for quant investing. Here are some templates you can build:
Buy Tesla every time Ford or GM drops 10%
Execute paired switching trades between ARK and Bitcoin ETF
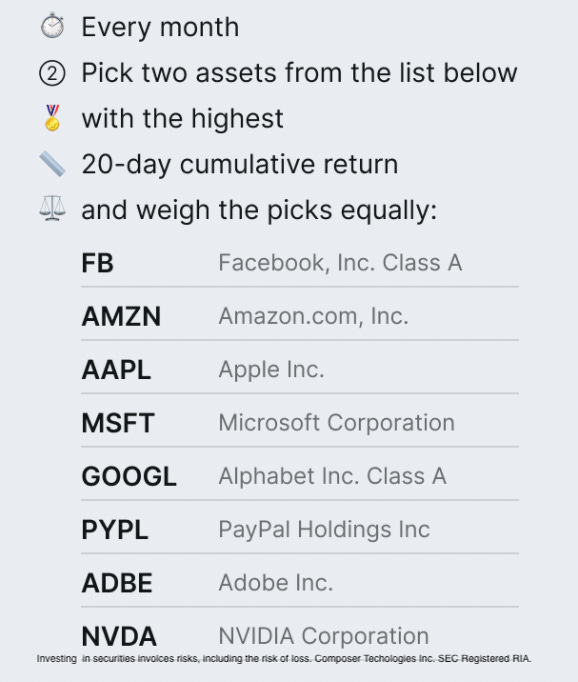
Big Tech Momentum 👇
The app is super easy to use and 100% free. Use my Market Sentiment link to sign up.
Stock splits are all the rage - After Google announced in Feb that there would be a 20:1 stock split in July this year, Amazon has followed suit announcing a similar 20:1 split and sending the market into a frenzy. Amazon’s price was up by 6% the next day and Google’s stock rose more than 9% in after-market trading following the news.
We do know that stock splits do not affect the underlying business in any way, but it is undeniable that there is price movement around the announcement and execution of a stock split. So in this week’s analysis, let’s deep-dive into the world of stock splits, how and why they are executed, and most important… Is it possible to make money off of a stock split?
What is a stock split and how is it executed?
A stock split is a simple decision by the company board to increase (or in some cases decrease) the outstanding shares of the company. For example, let’s say you own 10 shares of company X worth $100 each. So in total, you own $1K worth of shares in the company. If the company announces a 2-for-1 stock split, now you will have 20 shares of the company worth $50 each. But the total value of shares you own in the company does not change. You will still own the same $1k (20 x 50) worth of shares that you started with.
If you are wondering why companies engage in stock splits, the following are some of the key reasons.
Affordability: Sometimes the stock becomes too expensive for retail investors to buy into. Consider Amazon - One stock is worth close to $3k now. So the minimum amount you would need to start investing in Amazon is $3k which might not be affordable to a vast majority of retail investors.1 Also there is the psychological impact of buying a share worth $3k and a share worth $30.
Options: For the options players, there is a huge difference when a stock is cheap. In options, a single contract is worth 100 shares. So for a covered call strategy incorporating Amazon, before stock split, you would need a single stock position worth more than $275K vs only ~$14K exposure after the said 20:1 stock split.
Liquidity: Since more shares are outstanding for the company after the split, it will result in greater liquidity and a lesser bid-ask spread. It also allows the company to buy back their shares at a lower cost since their orders would not move up the share price as much, due to higher liquidity.
Now before we jump into the analysis, you should understand how exactly a stock split is executed. On announcement day, investors get to know that a stock split is going to happen soon. The stockholders eligible for the stock split are decided on the record date. This is mainly a formality. The actual split would happen on the ex-split date (or ex-date). After this, the stocks would start trading at their new price. For example, in a 20:1 split, the stocks would trade at 1/20th the previous price after the ex-date. From our data, we observed that there was an average delay of 36 days between the announcement day and ex-split date.
Data
For this analysis, I have used the data from Fidelity’s stock split calendar that tracks the announcements and execution of stock splits, from as far back as 1980! I have considered splits only from 1993 (due to stock price data availability), and I have considered only companies that currently have a market cap of $1Billion or above. I have also ignored reverse stock splits as the data is too small to be statistically significant.
This gives us a total of more than 2,000 stock splits to work with. In case you are interested in the raw data, I have shared both the raw data and analysis through links at the end2.
Returns
As soon as a stock split is announced, there is bound to be a lot of buying and selling activity. The question is, how much return could you have seen? There are a few scenarios possible here.
Short Term Returns
The short term plays possible around stock splits are:
You already own the stock and see its price go up on announcement day.
You did not own the stock on the announcement day so you buy the stock just before the actual stock split execution.
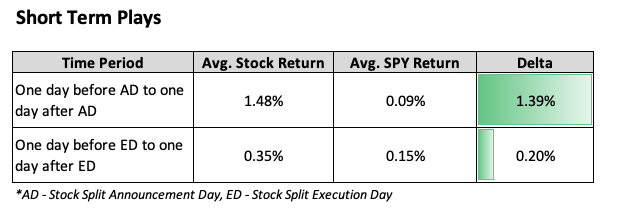
As expected, the announcement of a stock split sends the stock pumping with a 1.48% 2-day return when compared to only 0.09% return generated by SPY during the same time period. You would still have beaten the market if you had bought the stock one day before the actual split execution day and then held it for two days (albeit by much less - 1/7th of the gains you would have made if you had owned it before the announcement).
Long Term Returns
Considering that a stock split is supposed to indicate growth prospects, what happens when you hold for a longer time? There are two possibilities:
You buy the stock just after the announcement of the split
You buy the stock on the split execution date.
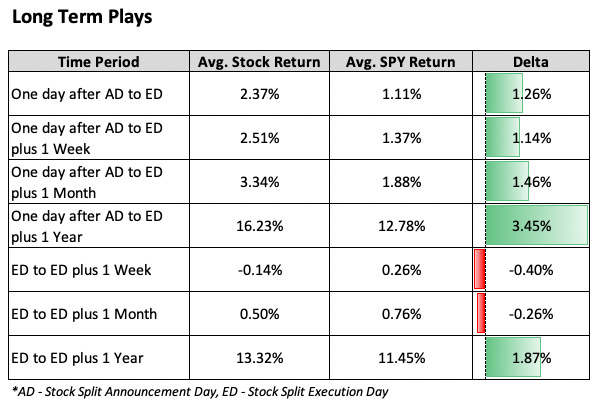
Buying just after the announcement would have paid off handsomely with the returns beating the market easily in the long run. On average you would have had an alpha of 1.5% over the market in just over a month.
But, on the other hand, if you buy it on the day of the split, the returns are not that great. You would have lost money in the first week on average and would have been underperforming SPY even over the period of one month. You would have had to wait about a year for your portfolio to overtake SPY. This is to be expected because by the time of the actual split, the hype has died down a bit and the rallies in price are a bit more uncertain.
What about HODLers?
This is another interesting case where you would have bought stocks on their announcement date or ex-split date and held on till today, starting from 19933. Though most people wouldn’t trade by this strategy, it’s interesting to see how it would have fared.4
If you had bought all stocks that underwent a split and held till today, you would have beaten the S&P 500 by close to 200%!
How certain are our returns?
Next, we have to look into whether the alpha we are seeing here is due to a few stocks that are skewing the results. Even though I have capped for outliers, I wanted to know what % of stocks undergoing a split beat the market over the different time periods that we just saw.
Well, would you look at that! Except in one case, the odds would be in your favor to beat the market if you had followed this strategy. As expected, for short term the highest chance is if you had owned the stock before the announcement (which is not realistic), but even if you had bought it one day after the announcement, you would have had almost a 60% chance of beating the market by the actual execution day.
The cheap and the expensive
The usual rationale behind a stock split is that the stock has become too over-priced, and splitting it makes it cheaper for retail investors to buy into - But the data revealed some contrary insights. Over 90% of the stocks were less than $52 in value at the time of the split, and only 5% were over $230 in value!
So obviously, the question is - Was there an advantage to buying cheaper stocks or more expensive stocks at the time of a split, and how did they compare to the total set and the benchmark?
The 10 percentile value for the adjusted close at the time of announcement was $3.50 (203 stocks less than this value), and the 90 percentile value was around $43 (203 stocks more than this value). Here are the average returns for these sets.
The lower-priced stocks seem to have a massive advantage in almost all respects, sometimes giving a return of more than twice the complete set of splits in the long term! On the other hand, the higher-priced stocks have a poor record - Though they beat the benchmark in the short term5, in the long term, their performance is much lower than the stocks having a lower price.
One of the reasons that the lower-priced stocks have such a high average is because stellar companies like Microsoft, Apple, Nvidia, Nike, etc. were trading for less than 5 dollars per share in the 90s - But this doesn’t invalidate the observation. There were stocks trading for more than 100s of dollars around the same time, and they didn’t do as well as the lower-priced stocks. This insight could mean that companies with a lower share price that go for a stock split now have a higher possibility of growth than huge stocks like Amazon or Google.
Limitations
The analysis seems to indicate that stock splits are a sure-shot buy. But there are some caveats to keep in mind before trying to replicate this:
There are a variety of large, mid, and small cap stocks that underwent stock splits. Comparing the returns solely to the S&P 500 might not be the most ideal way to calculate Alpha since the S&P 500 comprises of the biggest 500 companies in U.S. So the alpha we are seeing here might just be compensating for the extra risk we are taking buying into smaller companies.
The stock splits selected here are companies that have a market cap of at least $1Billion.
Conclusion
Buying and holding stocks at the time they are undergoing a split might not be an outrageously successful strategy - But it definitely has an edge, both in the short term and especially in the long term. This gives some credence to the statement that a stock split indicates good prospects of growth.
And if you’re wondering whether the right time to buy is during the announcement or the actual split, the data shows that there is a clear advantage to buying around the time of the announcement, especially for short-term plays. The probability of success is also 60% and above in many cases, indicating that there is something more to this than mere chance.
And finally, stocks with a smaller price seem to do much better than stocks with higher prices when it comes to stock splits. While this could just be the compensation for the risk you are taking investing in smaller companies, it’s definitely worth looking into!
Data: All the raw data for the stock splits and returns for additional time periods that I could not showcase in this article can be found here.
More interesting reads
This week, I’m going to be plugging some content of my own - but with a difference. Many times, I find trends, insights, and interesting ideas which I can share through a short piece of writing. The newsletter might not be the best platform for such short pieces, so I have started a Quick Reads corner where I will be posting such pieces.
Here’s the first piece, on how the stock market performs in a recession. Do let me know what you think!
Along similar lines, to own a single Class A share of Berkshire Hathaway, you need $489K. There are some theories that certain companies have very high share prices because they don’t want retail investors (who are usually fickle in ownership) to own their stock. This usually leads to lesser volatility for the said stocks. One other point to consider here is that there are more and more brokers who are offering fractional shares these days. So stock splits might not be as relevant as it was before.
This should make your life much easier as we had to use web scraping to pull all the data.
Walmart split its stock 11 times on a 2-for-1 basis between their IPO in October 1970 and March 1999. An investor who bought 100 shares in Walmart’s IPO would have seen that stake grow to 204,800 shares over the next 30 years!
In fact, there was an ETF that bought stocks that were going for 2:1 stock splits.
Not shown here, the complete analysis is in the data shared at the end.
Disclaimer: I am not a financial advisor. Do not consider this as financial advice.
If you enjoyed this piece, please do us the HUGE favor of simply liking and sharing it with one other person who you think would enjoy this article! Thank you.


Great Analysis - But what about the logic showing the contrasting results between
One day after AD to ED plus 1 week [2.51%]
how can this be more than
One day after AD to ED [2.37%]
yet
ED to ED plus 1 week is negative [-0.14%]
There's something not right about the maths here, it doesn't add up
Am I missing something?
Please let me know
Great Analysis - But what about the logic showing the contrasting results between
One day after AD to ED plus 1 week [2.51%]
how can this be more than
One day after AD to ED [2.37%]
yet
ED to ED plus one week is negative [-0.14%]
There's something not right about the maths here, it doesn't add up
Am I missing something
Please let me know