

Growth vs. Value
It was the best of times, it was the worst of times

An excess of something gives rise to its opposite.
– Carl Jung
Let’s start with a quick poll:
If you chose growth, you were likely influenced by the recent excellent returns of growth stocks, a common recency bias. While none of us have a crystal ball, let’s look at what happened the last time growth stocks significantly outperformed value stocks.
U.S. large growth funds produced incredible returns in the run-up to the top of the dot-com bubble in 2000. From 1995 to 2000, the Dimensional U.S. Large Growth Index outperformed the Dimensional U.S. Small Value Index by 10.26% yearly1! While most investors were happy with the raw returns, a concerning trend that was missed by many was that almost all of the returns were driven by an increase in valuation rather than an improvement in the business fundamentals. The P/E ratio of U.S. large growth stocks doubled from 15.8 to 30.3 compared to the only 5% increase experienced by small-cap value stocks.
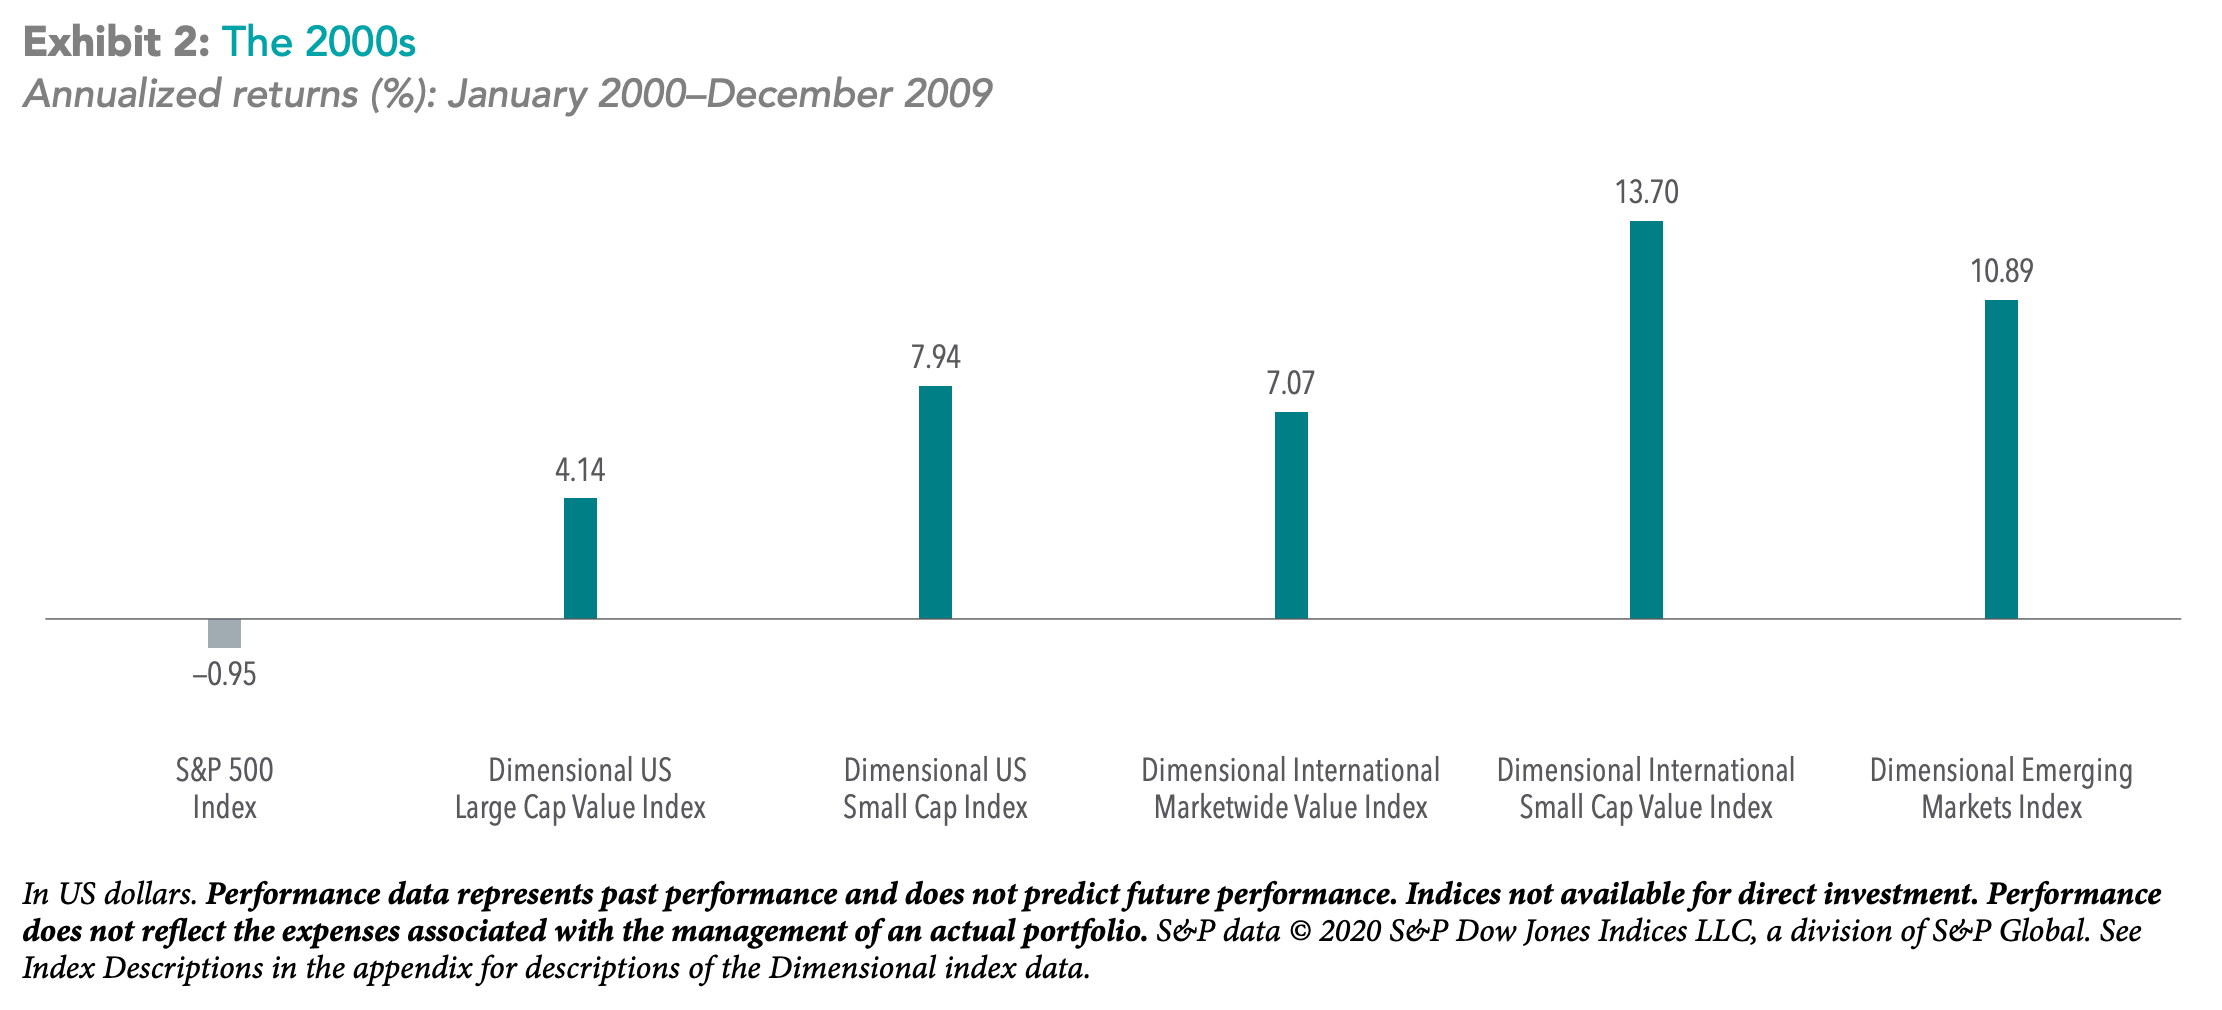
Unsurprisingly, what followed was a lost decade for U.S. equities. The S&P 500, which gave an annualized return of ~10% before 2000, gave a disappointing -1% annualized return from 2000 to 2009. During the same time period, the performance of the US Small Value Index flipped and gave a whopping 12.14% CAGR from 2000 to 2011.
Due to their poor performance, by mid-2010, only 2 of the top 10 companies in the S&P 500 were growth stocks.

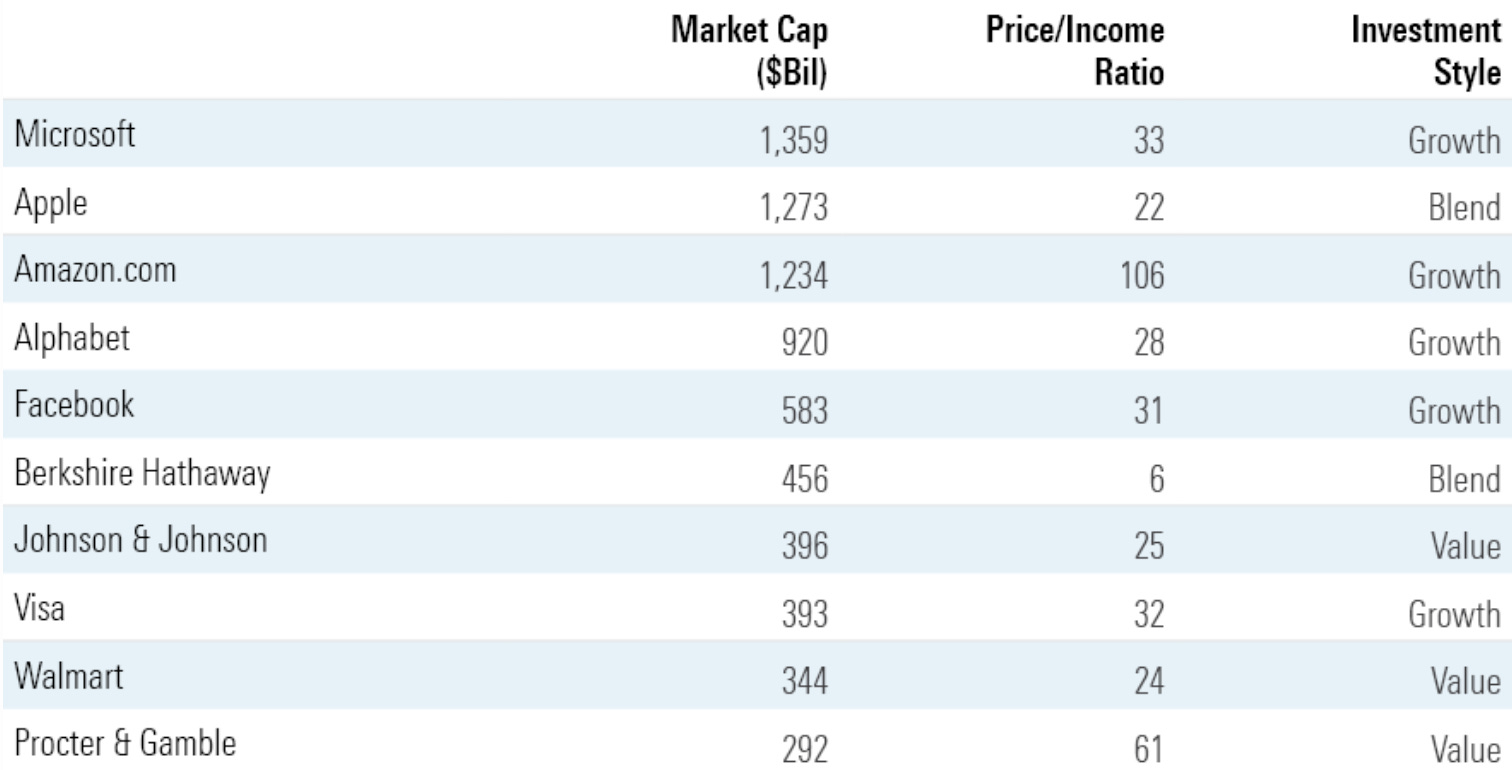
Fast forward 10 years to 2020, we see a complete shift in the top 10 stocks in the S&P 500. 5 of the top 10 stocks are growth stocks (6 now with the addition of Nvidia), and the PE ratio has more than doubled for most of the growth companies.
The average P/E ratio of the Russell 1000 Growth Index at the beginning of January 2010 was ~24, and it has now jumped to 32 (a 33% richening in valuation), whereas the value index has more or less stayed steady at 18.
This richening of valuation has significant implications for long-term investors.
There were three periods (1929-47, 1966-82, and 2000-17) of at least 17 years when the S&P 500 underperformed five-year Treasuries.
All three periods began with the 10-year cyclically adjusted P/E ratio, or Shiller P/E ratio, for the S&P 500 at historically high valuations (27.7 in January 1929, 23.7 in January 1966, and 42.18 in January 2000). — Larry Swedroe
According to Vanguard Research, valuations are the best predictor of future returns, and the longer the investment horizon, the larger the role of valuations.
Let’s dig in: