Ideastorm #13
Risk-return relationship, index fund bubble, "excellent" companies, and more...
Welcome to the latest Ideastorm. Market Sentiment curates the best ideas and distills them into actionable insights. Join 39,000+ others who receive curated financial research.
Actionable Insights
Contrary to popular wisdom, investing in high-volatility stocks does not yield exceptional returns.
Fund managers from poor families outperformed managers from rich families.
Picking companies based only on great financial metrics will not lead to outperformance.
We are still far from an “index fund” bubble, as 95% of trading activity is conducted by active traders, pension funds, and institutional investors.
Speculation for speculation’s sake
A classic mistake many investors make is associating a higher return with a riskier asset. Consider the example of investing in treasury notes vs. an upcoming small-cap. With treasury notes, you are assured a 3 to 4% return at the end of the year. There is only one highly unlikely scenario of a U.S. default where you would not get the payout.
Compare this to the small-caps, where the range of outcomes is much higher. The company can go out of business or double its stock price in a year, giving you a windfall.
To compensate for this extra uncertainty, you expect a higher return (compared to treasury notes). No one would invest in small caps if their average expected return was comparable to that of treasury bonds.
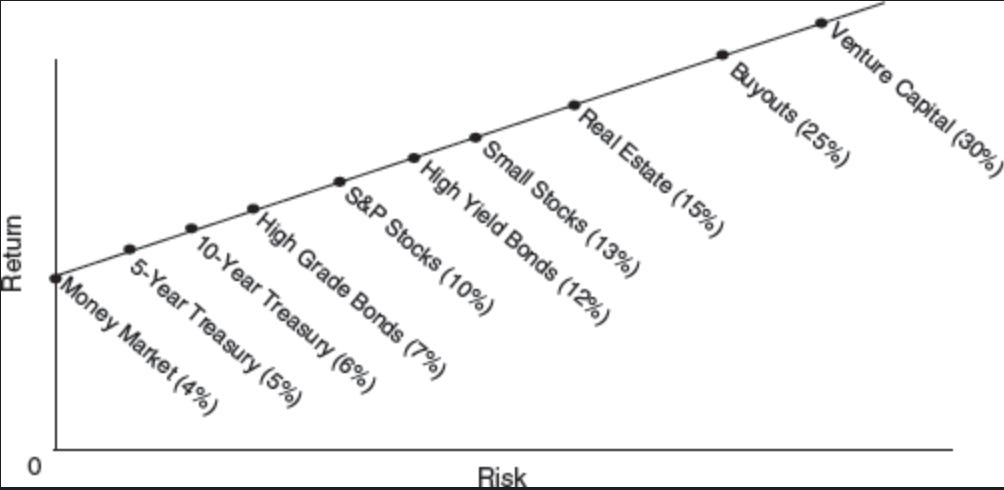
If we extrapolate this logic to all other investments, we get a familiar chart like this:
The problem with the above approach is that investors make the wrong conclusion after seeing it. It only communicates the positive relationship between risk and return. In good times, it’s easy to look at the high returns of the riskier investments and then think that they should have invested there.
The better way to think about it is that in order to attract capital, riskier investments have to offer the prospect of a higher return—not a guarantee of a higher return. If we add this nuance to the above risk-return chart, we get a much better way to visualize the risk-return relationship.
The latest update on UBS’s Global Investment Returns Yearbook gives us the best example of the downsides of high-risk investing. They evaluated the stock price performance of various stocks in the U.S. market since 1963 and ranked them based on volatility. The results were mixed for low and medium-volatility stocks, with volatility not affecting the return. But, the stocks with the highest volatility (aka riskiest) dramatically underperformed the rest.
Jim O'Shaughnessy, in his book What Works on the Wall Street, had similar findings using the PE ratio as a metric. When you buy into companies due to an amazing story and an expectation of future growth, you are most likely bound to be disappointed in the end.
(emphasis added throughout, edited for clarity):
Both All Stocks (comparable to the Total Stock Market) and Large Stocks( comparable to the S&P500) with high PE ratios perform substantially worse than the market. Companies with low PE ratios from both the All Stocks and Large Stocks universes do much better than the universe.
In both groups, stocks with low PE ratios do much better than stocks with high PE ratios. Moreover, there’s not much difference in risk. All the low PE groups provided higher returns over the periods, with lower risk than that of the universe. – Excerpt from What works on Wall Street.
Source: How investors get risk wrong (The Economist), What Works on Wall Street (Jim O'Shaughnessy), Global Investment Returns Yearbook 2024 (UBS) — Only a summary version is available to the general public.
Meritocracy triumphs inheritance
Most of us have seen a situation where someone got hired due to their wealth or connections rather than their raw skill. Nowhere is this more prevalent than on Wall Street — When researchers evaluated the income of the families from which the fund managers came, they found that fund managers’ fathers reported a median income of $2,000 (in the 1940s), which put them in the top 10% of national income.
While this can be justified in some ways, what was interesting was that mutual fund managers from poor families outperformed managers from rich families.
We argue that managers born poor face higher entry barriers into asset management.
Consistent with this view, managers born poor are promoted only if they outperform while those born rich are more likely to be promoted for reasons unrelated to performance.
Managers from families in the top quintile of wealth underperform managers in the bottom quintile by up to 1.36% per year (significant at 1%) on the basis of the four-factor gross alpha. Similar results hold for alternative measures of performance, such as benchmark-adjusted fund returns and the dollar value extracted from capital markets — Excerpt from the paper
Source: Family Descent as a Signal of Managerial Quality: Evidence from Mutual Funds
Excellence is over-rated in investing
There’s a popular urban legend known as the Sports Illustrated cover jinx, which suggests that when an athlete makes the cover of Sports Illustrated, he or she will be “jinxed” and not perform up to the expectations. While there is a long list of examples showcasing the jinx, the rational explanation would be that the added press and distractions from the feature might be distracting the athletes.
Michelle Clayman had a similar concept for businesses. In his 1987 article "In Search of Excellence: The Investor's Viewpoint,” he examined the stock market performance of companies identified as “excellent” based on financial characteristics1 and compared them with 39 “unexcellent” (again, chosen based on the same financial characteristics) companies.
The study had two striking results:
There was significant evidence of reversion to the mean, with the growth and profitability of the excellent companies slowing over time.
The unexcellent companies as a portfolio outperformed both the excellent companies and the S&P 500.


