Ideastorm #6
Total shareholder returns, optimal rebalancing strategy, cost of stock picking, and more...
Welcome to the latest Ideastorm. Market Sentiment curates the best ideas and distills them into actionable insights. Join 37,000+ others who receive curated financial research.
Actionable Insights
From 2012 to 2021, S&P 500 had an excellent annualized return of 16.6%, but 41% of this was driven by P/E multiple expansion.
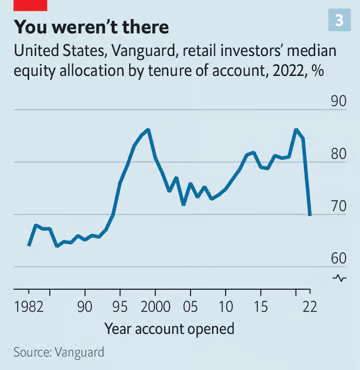
Investors who opened their accounts during bull markets tend to have significantly higher equity allocation, even several decades later.
For most investors, a simple annual rebalancing strategy is the optimal point between maximizing risk-adjusted returns and minimizing complexity & transaction costs.
An active investor who engages in stock selection and market timing without genuine skill underperforms the market by ~2% per annum.
1. What drives shareholder returns?
In the latest report by Counterpoint Global1, Michael Mauboussin breaks down the various drivers of total shareholder return. Over the last decade, the S&P 500 had an excellent annualized return of 16.6%.
However, a concerning aspect of this is that a significant proportion (41.6%) was driven by P/E multiple expansion (i.e., the stock price is rising faster than the underlying earnings). Interest rate drops were the key driver for this multiple expansion.
An interesting side note is that AQR research also recently published a report arguing that the U.S. outperformance (over international stocks) was mainly driven by valuation changes rather than fundamental economic improvements.
(emphasis ours)
Since 1990, the vast majority of the US’s outperformance versus the MSCI EAFE Index (currency hedged) of a whopping +4.6% per year, was due to changes in valuations.
The culprit: In 1990, US equity valuations (using Shiller CAPE) were about half that of EAFE; at the end of 2022, they were 1.5 times EAFE. Once you control for this tripling of relative valuations, the 4.6% return advantage falls to a statistically insignificant 1.2%.
In other words, the US victory over EAFE for the last three decades—for most investors’ entire professional careers—came overwhelmingly from the US market simply getting more expensive than EAFE.
Source: Total Shareholder Return (Counterpoint Global Insights)
2. When you started investing matters more than you think
Imagine two new investors, Bob and Alice, who start investing in the market only five years apart. Bob started investing in the stock market in January 2007, swept up by the euphoria of the bull market. But he’s a prudent investor - Despite the rapid increase, he invests only $100 in the S&P500 every month. But you know where this is going. The market crashed in 2007, and even though Bob continued to invest, his returns kept dropping.
On the other hand, Alice began investing in 2012, and she follows the same strategy of putting in $100 a month. As luck would have it, it seems like the market has nowhere to go but up! In fact, Alice gets in at the beginning of one of the longest bull runs in history, and she never had to worry about her portfolio.
Bob is off to a disastrous start - His portfolio is in the red 78% of the time, and his portfolio drops 41% in value at one point. Even though he has read that the market will bounce back in the long term, his conviction starts to wane. On the other hand, Alice’s portfolio has positive returns in 35 out of 36 months - and the only drop in value is by 4%!
These results will have a massive long-term impact on both Bob and Alice. Technically, Bob has a better buying opportunity than Alice2, but the consistent market decline during the first few investment years becomes the formative experience for Bob and will affect his equity allocation for decades.
Andy Reed, who is the head of investor behavior at Vanguard, points to some interesting evidence that shows that investors' early experience shapes their asset allocation over many years.
Investors who opened their accounts during bull markets tend to have significantly higher equity allocation. The median investor who started investing in ‘98-99 (during the euphoria of the dot-com bubble) had 14% more stock allocation than someone who started in ‘03. Due to the anchoring bias, people's first experiences have undue weight in their minds. Also, humans react more strongly to loss than the prospect of a gain.
3. What is the optimal rebalancing strategy?
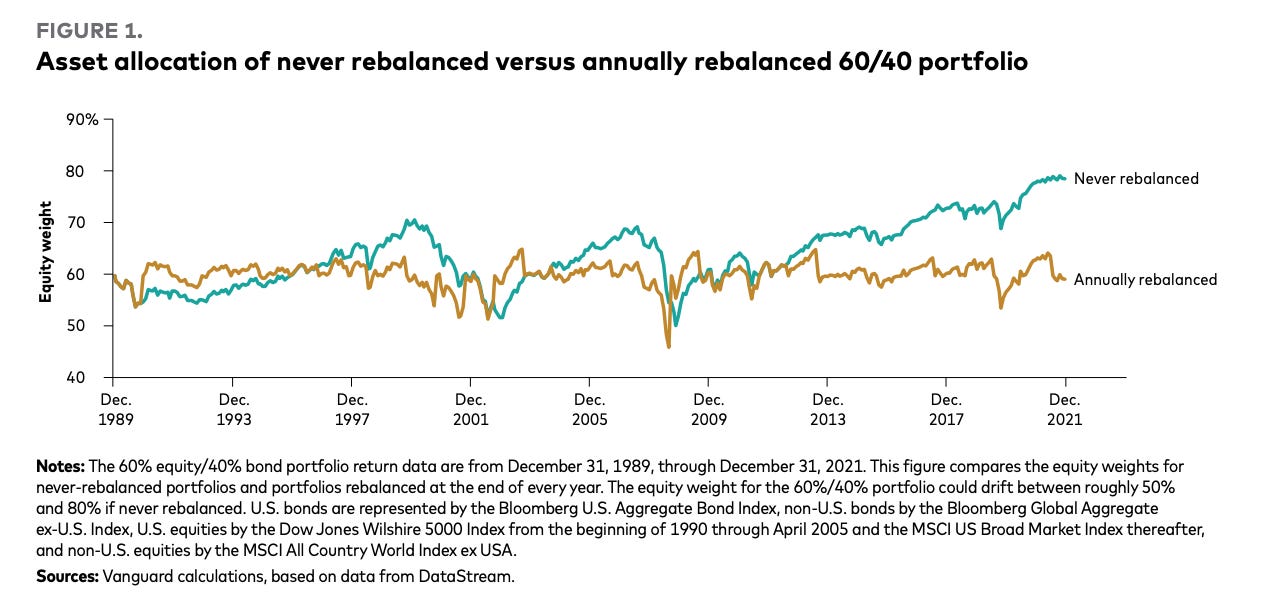
In our last deep-dive, we highlighted how a 60/40 portfolio started in 1989 would have had 80% equities by the end of 2021 if you never rebalanced.
The primary function of portfolio rebalancing is to keep the portfolio risk within your risk tolerance. Some of the most popular rebalancing approaches are:
Calendar-based rebalancing: This is the simplest approach where we pick a time frame (quarterly, semi-annually, annually, etc.) after which we rebalance the portfolio to target allocation.
Threshold-based rebalancing: Here, we allow the portfolio to drift within a tolerance threshold after which we trigger rebalancing. This requires the portfolio to be monitored daily and depending on how small is the threshold, you might have higher transaction costs.
Calendar- and threshold-based rebalancing: Combines (1) & (2). For e.g. — at the end of the year, rebalancing will only take place if the thresholds we set have been breached.
So, among these numerous rebalancing methods, which one is the most efficient?


