New Normal?
Digging into American Exceptionalism

The greatness of America lies not in being more enlightened than any other nation, but rather in her ability to repair her faults. — Alexis de Tocqueville
In our 2035 report we published a few weeks back, we covered four worrying trends that all pointed towards an over-valued U.S. Market. Unsurprisingly, we received a lot of feedback from our readers on how we are looking at this the wrong way and how what we consider an expensive market might just be the “new normal.”
For example, if you just look at the price-to-forward earnings ratio of the U.S., it’s almost double (21) that of the UK (11)1. But when you dig into this, you realize it's not an apples-to-apples comparison. Tech companies make up only 1% of the U.K. market, whereas it’s 32% of the S&P 500. Given that tech companies inherently have a higher valuation due to their higher growth prospects, adjusting for these sector weights significantly reduces the valuation premium.

In fact, even at these extended valuations, the gap between the U.S. and other countries continues to widen. In 2024, the U.S. economic growth was 2.4%, nearly 3 times the 0.8% in the rest of the developed economies. The productivity gains in the U.S. were at 2.3% compared to 0.6% for the UK, 0% for the Eurozone, and a marginal decline in Japan.
Let’s dig into why the US continues to outperform, how the current market valuation might be justified, and whether we can expect the same level of stock market performance going forward:
American Exceptionalism
Everyone knows that the U.S. is the largest economy in the world, accounting for more than a quarter of the world's GDP. It’s poised to retain this title for the foreseeable future. Since 2018, the U.S. GDP has grown by $7.8 trillion—double that of the next fastest-growing country (China, $4.2 trillion).
This exceptional growth is powered by investment in innovation. Take a look at the list of the top 10 countries ranked by R&D spending. The U.S. spends twice that of the nearest competitor and ten times more than all the emerging markets put together. This, along with the fact that the U.S. accounts for 17 of the top 30 universities in the world, effectively makes sure that the U.S. leads the world in innovation.

This level of investment meaningfully impacts the capital markets. At the end of 2024, the U.S. had 48 tech companies generating more than $1 billion in profits. To put this in perspective, it’s more than all the other countries put together! (Japan - 8, Europe - 7, China - 7, Taiwan - 5, Korea - 4, France - 2, Germany - 2).
Investors seem to have realized this. Historically, China was a major destination for foreign investment due to its rapid economic growth and manufacturing dominance. But now, the FDI inflows have dropped to near zero as investors are skeptical about China’s long-term prospects (We covered the performance of the top 10 global economies in our last report).
The Eurozone is in deep trouble compared to China. Capital has been actively fleeing Europe at an accelerating pace ever since the pandemic. Despite rising inflation and policy uncertainty, global investors still see the U.S. as a safe haven for capital.

The problem with valuations
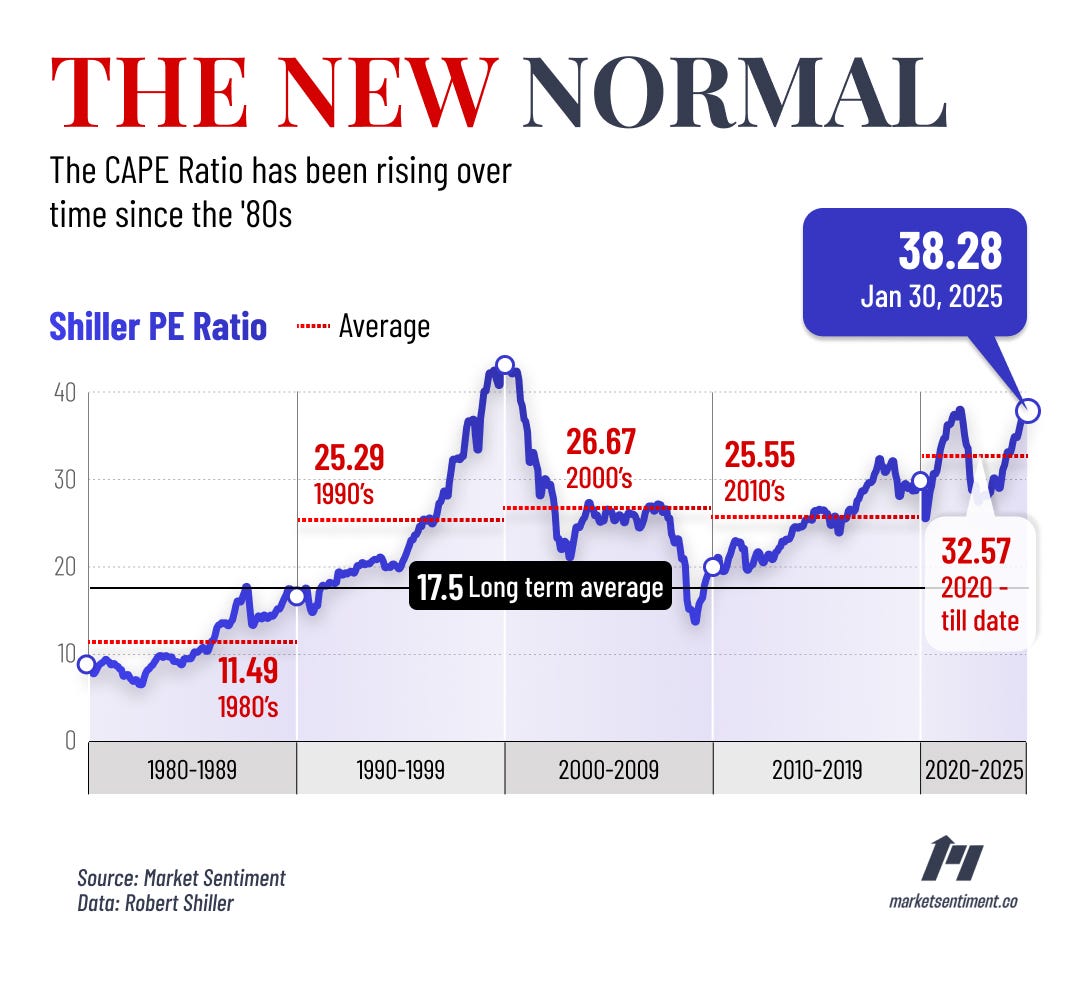
The biggest proponents of moving away from the U.S. markets are value investors. The key indicator that’s driving this is the CAPE ratio. Simply put, it’s the valuation measure that tells you where the market is trading compared to how much the companies have earned in the previous 10 years. The highest it ever reached was 42 in Aug 2000, just before the dot-com bubble popped.
The CAPE ratio is now 38 (Feb 2025), one of the highest points it’s been at since the dot-com bubble. But, investing solely using this metric is missing the forest for the trees.