

Should you invest in sustainable companies?
I analyzed over 10 years of data on the World's Most Sustainable companies and here is what I found

Welcome to the 205 investing enthusiasts who have joined us since last Sunday! Join 12,554 smart investors and traders by subscribing here:
This issue of Market Sentiment is brought to you by… Titan
"You’ve tried the Do-It-Yourself investing apps. You’ve tried passive options like ETFs and mutual funds. Now it’s time for a different approach: Expert investing, done for you.
Think about it. With Titan, you get a team of dedicated investment experts handling your stock picks, investments, and hedges for you—all while keeping you updated through snack-sized trade updates. It’s like having your own personal investment team, right in your pocket.
It’s active investment management like you’ve never seen before.
Getting started takes seconds. Join over 35,000 clients who trust Titan with over $750,000,000 of their hard-earned capital.
We have all come across articles highlighting how much damage certain companies are causing to the environment.
Just 100 companies responsible for 71% of global emissions - The Guardian
Just 20 companies are responsible for over half of ‘throwaway’ plastic waste - Minderoo Foundation
Chevron had to settle for $9.5 Billion after they deliberately dumped billions of gallons of toxic oil waste in the Amazonian provinces - New York Times
Though it’s great that all of these issues are being highlighted to the public, it only becomes major news once there is a huge oil spill or a multi-billion dollar settlement or when irrecoverable damage is already done.
While there are 100s of sustainable ETFs out there, most of them work on the principle of eliminating stocks that have a bad rep or reweighting in such a way that environmentally damaging companies get lower portfolio allocation. Adding to this, that extra 0.5-1% in expense ratio that ETFs charge will amount to hundreds of thousands of dollars over the long run!
The strategy I have developed is to invest only in the most sustainable corporations in the world. The idea here is simple. You invest only in the public companies that feature in the top 100 list. Then we benchmark the returns that you would have generated investing in sustainable companies vs if you had invested in S&P 500!
So the million-dollar question here would be: Can you have your cake and eat it too? Would your portfolio have to take a hit for doing the right thing or can you beat the market by investing in sustainable companies?
Strategy
While there are many companies that rank corporations based on sustainability, I chose Corporate Knights’ most sustainable rankings as the benchmark for my analysis. This is mainly due to these reasons:
They consider only public companies with revenue of at least $1 Billion [1].
They have been doing it for the past 17+ years which would give us enough data to understand how the long-term trend is going to be.
Finally, I found their methodology most comprehensive taking into account more than 21 KPIs which are all based on publicly-disclosed data [2].
One caveat here is that I am only considering U.S Companies in the list, as it would be much easier for us to invest in the U.S market when compared to a foreign market such as China/India.
Results
You would have made a total of 155 investments across 56 different companies over the past decade (The same company can appear in the list in multiple years). The good news is that you wouldn’t have lost money investing in sustainable companies. The great news is that you would have beaten the market while doing so!
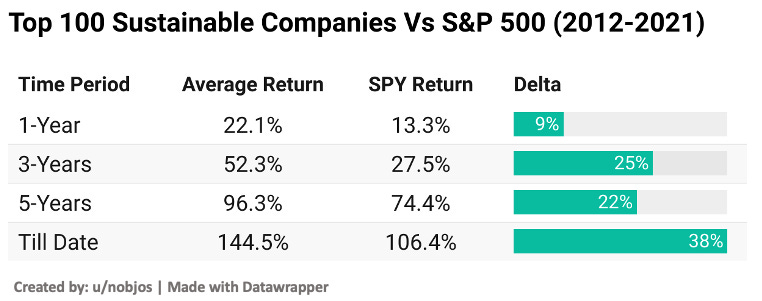
As you can see from the below chart, on average, the most sustainable companies outperformed the market by 9% in a 1 year period, and if you consider to-date returns, you would have made ~38% more than you would have made just investing in SPY.
A more interesting insight is how ‘sustainable’ sustainable investing really is. If you are a long-term investor, the chances of you losing money on sustainable companies is virtually zero. As you can see from the below chart, you would have made lesser returns than SPY in only one year (2014) out of the 10 years in analysis.

This shows that no matter how you look at it, sustainable investing looks promising and it’s not one or two outlier years that are skewing the overall returns.
Some Caveats
Before you try to replicate the strategy, you should be aware of some of the limitations of this analysis.
I am only considering U.S stocks in the analysis. For my friends across the world, you can filter out your country from the top-100 list directly! Checking whether it will generate similar kinds of returns is up to you :) - You can duplicate my tracker and just change the input stocks.
The returns shown here are not risk-adjusted. The alpha you are generating might be due to the higher risk that you are taking on environmentally-conscious companies.
There are arguments that sustainable investing is just a marketing ploy. There are companies (especially tech giants) that over-exaggerate their future plans of sustainable development to attract investors and get on the list [3] but might not follow through on their promises. I leave it up to the judgment of the reader to choose companies and rankings which align with their viewpoints.
Conclusion
I started the analysis skeptical about the overall impact, because if you are investing in a standard index fund such as the S&P 500, less than 3% of the index is contributed by Oil and Gas.
But as you can see from the below study done [4] by S&P Global while creating the S&P 500 ESG Index, more than 10% of the companies contributing to the S&P 500 are being eliminated for not following enviromentally sustainable practices.

While there are debates about the overall effectiveness of environmentally sustainable investing, it does make intuitive sense to not allocate your capital to companies that are actively hurting the environment.
I thought that we would have to end up taking a haircut on our investment return if we followed through with only investing in environmentally conscious companies but as our analysis shows, we are able to beat the market by investing in the world’s most sustainable companies.
This is truly one of those rare cases where you can have your cake and eat it too!
Until next week….
Data used in the analysis: Here (It’s a live tracker where I will be updating 2022 picks once it’s released)
More Interesting Reads
Doomberg: As the name suggests, they are all about bad news that is backed up by solid logic. Even more than their content, I love their monthly wrap-ups where they showcase how they are building a brand from the ground up and compare themselves to some amazing content creators. Their most recent piece on an imminent short squeeze on European Carbon Credits is worth a read. One of their readers summed up the feeling you get after reading Doomberg perfectly.
The stuff you don’t know you don’t know keeps shrinking
Ben Felix: Ever wondered whether there were any decent finance Youtubers left? - Look no more. Ben is a portfolio manager with an investment firm and educates the public about various aspects of investing. No click-bait, no products to push => just plain educational content. He has done a video on sustainable investing that you should check out! He also explains why professional financial advisors make sense even though they might not beat the market in the long run.
Footnotes and Existing Research
[1] This allows us to invest in the company. No matter how sustainable, if the company is private, it’s pretty much unreachable for us average investors.
[2] If you are interested, you can find their full methodology here.
[3] ESG (Environmental, Social, and Governance) investing has grown at a pace of 30% over the last 5 years and is expected to surpass $50 Trillion by 2022.
[4] The full study is available here.
If you enjoyed this piece, please do us the HUGE favor of simply clicking the LIKE button!
I took a look at the performance of stocks on the lists for 2005-2011 to see how the strategy performed in a decade that saw annualized returns of -0.95% for the S&P 500.
Key results as follows:
Holding Time, Avg Performance, Delta (vs S&P 500)
1 -Year, 13.29%, 9.21%
3-Year, 25.00%, 11.41%
5-Year, 53.89%, 16.46%
Till Date*, 488.62%, 187.28%
*Till date is Jan 10 2022
Great article! Thanks for putting it together for us.
Question: shouldn't the 1-year delta have been 6% and not 9% for the 1st chart?