

Bruised Blue Chips
The ultimate buy-the-dip strategy

Grab a cup of coffee for this one. It’s one of our most in-depth reports (and it’s free!).
At one point in 2022, the market cap of Meta (formerly Facebook) dropped as low as $230 billion. All in all, the company had lost $800 billion in market capitalization in just one year and was down 75% from its previous all-time high.

While the detailed reasons for the company's significant decline and subsequent rebound were captured in our case study, the TL;DR version is that the company experienced slowing growth in its daily active users and rising competition from TikTok.
Zuckerberg managed to turn it around through layoffs, buybacks, and copying numerous features from TikTok. The company is now up 700% from its 2022 lows!

So, why are we talking about Meta now?
In our last drawdown analysis, we selected all companies from the S&P 500 and invested in those that declined by either 75% or 90%. While the overall portfolio outperformed the market, it came at the cost of high volatility. There were a lot of multibaggers (GME, THC, ATI, etc), and a lot of zeros (DNR, FOSL, BBBY, etc.).
One of our readers (h/t sangram jog) pointed to this obscure report from a fund management company in India that took a slightly different approach. Instead of investing in any company that experienced a massive drawdown, they only invested in blue-chip companies — those in the top 50 by market capitalization1.
The results were incredible
The beauty of this simple filter is that it follows Buffett’s #1 rule of investing: Never lose money. The bigger the company, the lower the chance it will go bankrupt.
Building a drawdown portfolio
Inspired by this, we did a similar analysis by changing the universe to the S&P 500. We defined blue chips as companies that were in the top 50 by market cap of the S&P 500 (at the beginning of the respective year).
We then wait for any of these companies to drop by 50% before investing. The results were so good that we had to double-check:
Starting in 2016, the average buy-and-hold return of our portfolio would have been 177% vs 111% for the S&P 500.
A buy-and-hold portfolio employing this strategy would have outperformed the market every year from 2016 to 2020.
5-year return: 178% for the drawdown portfolio vs 141% for the S&P 500.
Of the 24 companies we have invested in, only three have lost money to date, and none have gone bankrupt.
Let’s dig in:

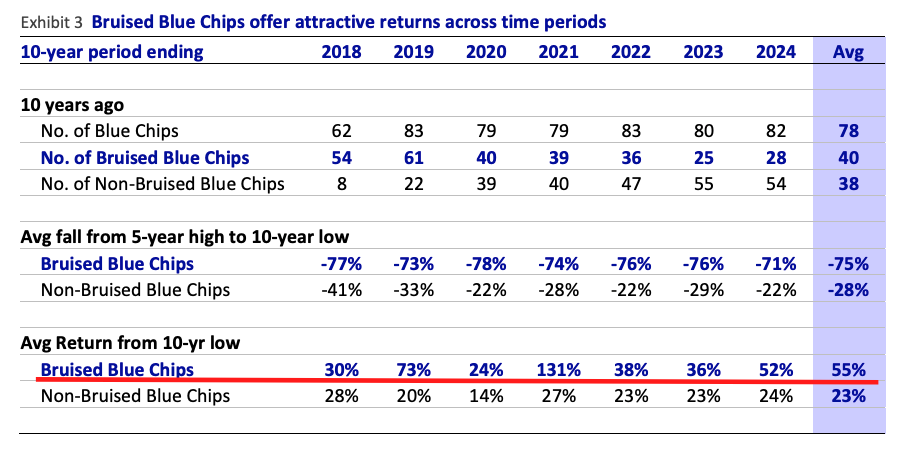
From our data, on average, 40% of the top 50 companies in the S&P 500 will undergo a 50%+ drawdown over the next 10 years.
This is pretty wild when you think about it — Even if you are in the top 50 public companies in the U.S., there is almost a 50/50 chance that the market cap will drop by atleast 50% over the next decade.
However, this offers us great entry points to these companies, which can provide asymmetric payoffs. Here are the best-performing stocks from our portfolio:

While everyone loves a multi-bagger, the downside protection offered is incredible. Of the 24 companies we have invested in, only three have lost money to date, and none have gone bankrupt.

Backtest data & company list — Here
Why do companies fall?
The next obvious question is, if these are some of the biggest and most profitable companies in the world, how do they undergo such drastic drawdowns?
The answer lies in a mix of external and internal factors.
External Factors
Stock market crash
Economic recession/slowdown
Govt regulations
Global events
For example, take a look at what happened during the 2020 COVID-19 crash:
Both Exxon and Chevron declined by more than 50% as lockdowns crushed oil demand.
Boeing was down 70% as the pandemic halted new orders, just when the company was already bleeding cash due to the 737 MAX issues.

And this is not a once-in-a-century trend. The same thing occurred to the Banking sector during the 2008 global financial crisis, and as recently as 2022, when most tech stocks lost half their value due to rising inflation and interest rates.

Internal Factors
On the other hand, a host of internal issues can also cause companies to have severe drawdowns.
Weak product
Capital misallocation
Poor management
Intel ($INTC)
Once the world’s largest chipmaker, Intel was in or near the top 50 by market cap through the 2010s. But missteps in technology roadmaps badly hurt the stock. For example, Intel infamously delayed next‑generation EUV chip manufacturing from 2014 to 2016, which set back its progress by years. This meant that by 2022, AMD had overtaken Intel’s market cap.
The company remains in a deep drawdown, having declined by 63% over the last five years.
AT&T ($T)
AT&T lost 70% of its value from 2016 to 2023. Cord-cutting bled subscribers from its DirecTV satellite, and two mammoth debt-financed deals did not generate the expected returns. ($49 billion for DirecTV in 2015 and $85 billion for Time Warner in 2018).
The company’s fortune began to reverse once the new CEO, John Stankey, abandoned the costly media experiment and doubled down on the core network. He spun off WarnerMedia to Discovery in 2022 and sold DirecTV to TPG to improve the balance sheet.
AT&T is up 97% from its 2023 lows.
3M ($MMM)
The management was overly focused on the stock price, spending far more on buybacks than on research and development. The product line also caused issues, as 3M’s military earplugs were alleged to loosen in soldiers’ ears, leading to the largest product liability in U.S. history ($6 billion settlement). The management had to change the CEO by mid-2024.
3M is now up 50% over the last year.
To me, the most interesting aspect of this investment strategy is the low mortality rate. Not a single company that we invested in went bankrupt.
As in the case of Intel, 3M, or AT&T, the companies made blunders of massive proportions. Yet, not even one went under. The fact that these companies had incredible brand power and strong balance sheets meant that they could mess up and still come back stronger.
We would argue that this is the ultimate buy-the-dip strategy as long as you are patient.
It’s precisely why we started Rebound Capital.
All great companies stumble. Investing in these companies during their inevitable drawdowns can provide incredible returns during their subsequent rebound.

Here is the case study of a high-quality company currently in a drawdown:

We would love to hear what you think. Reply to this email or
Footnotes
The exact criteria were: 1. Track record: Listing history of minimum 10 years. 2. Size: Top 50 companies by market cap. 3. Profitability: If not among the top 50 companies by market cap, companies need to fulfill two criteria to qualify as Blue Chips – (a) They must be within the top 250 stocks by market cap and (b) They must have 10-year average RoE (Return on Equity) of at least 20%.
I'm old enough to remember when Dogs of the Dow (a strategy rhyming with this one) was a thing. https://openjournals.libs.uga.edu/fsr/article/view/3856/3303
So in your revised model, do you screen for companies in the top 50 by valuation at their peak or that are still in the top 50 after the 50% drop in valuation?