

The Magic of Drawdowns
The best opportunities exist in uncertain times

Grab a cup of coffee for this one. It’s one of our most in-depth reports (and it’s free!).
Research in experimental psychology suggests that most people overreact to unexpected and dramatic news events. Nowhere is this more prevalent than in the stock market. Stocks that experience either extreme positive or negative movements tend to mean-revert in the long term. It’s because investors almost always overweight recent information and underweight prior data.
Let’s take a look at what happened with Netflix at the end of 2021. The stock was a pandemic darling and doubled from Mar’20 to Oct’21. Then the market turned.

Over the next 7 months, the stock lost 73% of its value. What’s incredible is that before the downturn, Netflix was worth $300B, employees were dying to work for the company (FAANG), and it was one of the strongest brands of the S&P 500. So what caused the downturn?
This small blip in growth.

In their latest earnings call on April 19, Netflix executives revealed not only that they had failed to reach the growth target that they had set for themselves, but said that subscriptions for the first quarter of 2022 had actually fallen. — NY Times (2022)
To put the long story short, Netflix had its first decline in membership in Q1’22 due to a combination of losing 700K accounts in Russia (due to pulling out of the market due to the Russia-Ukraine war) and outdoor activities opening up as the lockdowns ended. Investors believed that Netflix had saturated the market and had nowhere to go.
To address these concerns, Netflix introduced an ad-supported streaming tier and started a crackdown on password sharing. By the end of the year, the company blew past expectations and added 7.7 million new subscribers in Q4’22. The company is now up 551% from its 2022 lows.
This is not only the story of Netflix. Every major company goes through a period of crisis where investors write it off, only for it to eventually make a big comeback.
Still not convinced? Take a look at the worst drawdowns of the Magnificent-7 during the last 5 years.

There’s no reasonable explanation why Meta was down 76% or Nvidia was down 66% in 2022 — other than the fact that investor sentiment was extremely bearish and they were projecting the current trends to hold forever.
Here’s what we wrote about Meta in 2022:
No matter how you look at the company, the financial metrics are incredible. 80% gross margin and 30% ROE with growing revenue. But the stock is down 55% in the last 1 year.
I am not pitching it as a great business. They certainly have some incredible challenges ahead of them in terms of privacy and attracting a young user base. No one knows directly the solutions for their hardest problems—that’s why they’re the hardest ones.
But writing off a company based on two bad quarterly reports is just too short-sighted.
Building a drawdown portfolio
Now, the question becomes whether it’s possible to build out a portfolio that invests only in companies in drawdown. To test, we picked all the companies in the S&P 500 list as of 2015. The backtest is simple1 — If a company drops by 50%, we invest $100 in that company and then hold2.
We immediately ran into an issue. Out of the 502 companies on the list, 262 companies experienced a drawdown of more than 50% over the last 10 years. If you end up investing in all of them, your average return will be comparable to the index since you are holding half the index. (Average return of 114% for the drawdown portfolio vs. 123% for the S&P 500).
Where it gets interesting is when we increase the drawdown cutoffs.
Drawdown cutoff — 75%
Number of stocks: 91
Total amount of investment3: $9,500
Drawdown portfolio final value (June’25): $23,903 (151% return)
Comparable S&P 500 index: $20,467 (115% return)
Alpha4 — 36%
Median return: 68.4%
Drawdown cutoff — 90%
Number of stocks: 36
Total amount of investment: $3,600
Drawdown portfolio final value (June’25): $12,120 (236% return)
Comparable S&P 500 index: $6,705 (86% return)
Alpha — 150%
Median return: 75%
Backtest data & company list — here
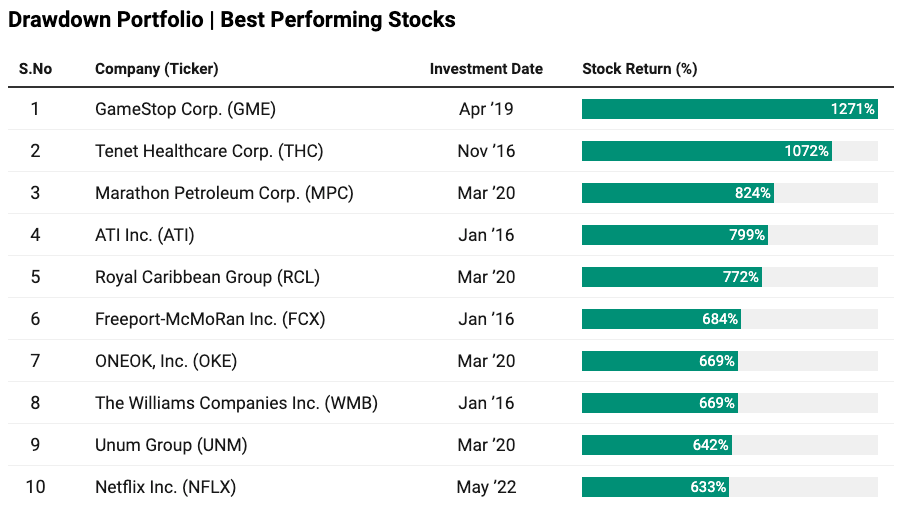
Best and worst performers
As you would expect, investing in companies that had significant drawdowns would be highly volatile. After all, a stock that went down 90% can again go down another 90%!
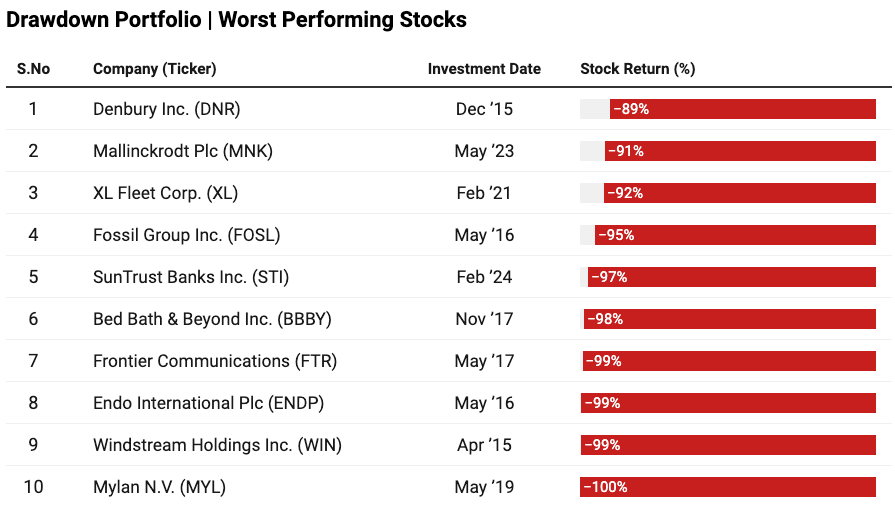
Buy and hold seems to be the best strategy, as there would be many multi-baggers..
.. and a lot of zeros in your portfolio.
Odds of a rebound
Just because a stock has reached a certain price point in the past is no guarantee that it will achieve the same valuation again. So, what are the odds that a stock in a drawdown will recover to its previous all-time high?
Michael Mauboussin of Morgan Stanley analyzed more than 6,500 companies from 1985 to 2024 and found that the probability of recovery is inversely proportional to the magnitude of drawdown. The more a stock drops, the lower the chance it will bounce back — for example, of the 1842 stocks that dropped more than 95%, only 1 in 6 made it back. However, of the 241 stocks that dropped between 50-55%, 3 in 4 made it back to their previous high.
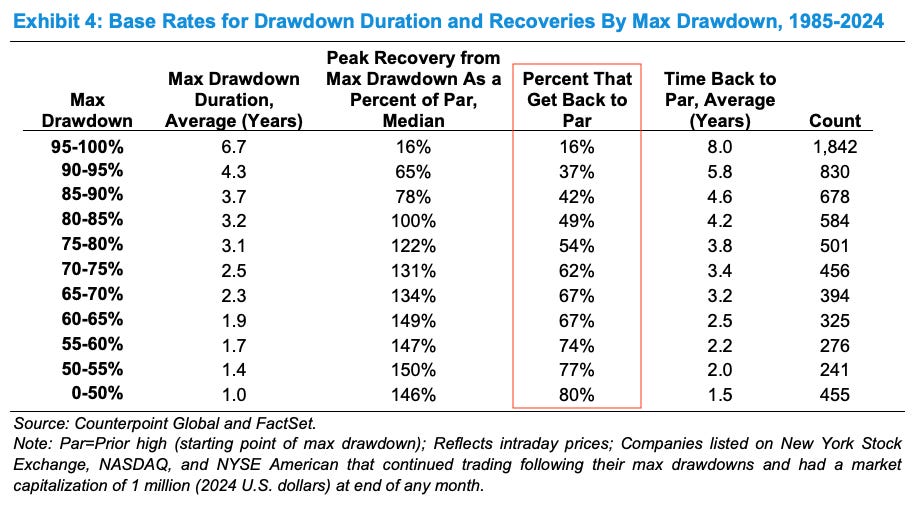
On the plus side, the stocks that went down the most offered the most return when they bounced back (matching with our own backtest above).

As we highlighted in our previous report, even the best investments have periods of massive drawdowns. Apple was down 83% at one point, and Home Depot was down 76%. These companies are the top 10 companies that generated the maximum shareholder returns in the past 4 decades!
With even an equally weighted portfolio outperforming the S&P 500 over the past decade, shouldn’t it be possible to filter a bit more for quality? Michael Mauboussin gives us ways to identify potential winners.
Are the fundamental issues with the company cyclical or secular?
Is the unit economics profitable?
How significant is the capital investment risk?
How strong are the company’s financials?
Is the management clear about the challenges?
As of today, from its ATH:
Nike is down 65%
Tesla is down 32%
ASML is down 27%
UnitedHealth is down 50%
All great companies stumble. Are all the above companies slam-dunk investments? I don’t know!
All we know is that investing in great companies during their inevitable drawdowns can provide incredible returns during their subsequent rebound.
That’s why we are launching Rebound Capital. It’s where we do deep research into beaten-down stocks to separate the wheat from the chaff. Join us here 👇

We would love to hear what you think. Reply to this email or
Footnotes
Backtest is adjusted for survivorship bias — companies that were acquired or dropped from S&P 500 were tracked.
If a company rebounds to a new all-time high and then drops 50% again, we will invest another $100 in the company.
Refer to the above footnote
Not risk adjusted
You might add one more variable. Stocks going down by x and then recover by Y before you buy. Say70/10. More optimized of course, but interesting.
Great stuff. I keep wondering, however, how to avoid error of commission. Some stocks fall below 50 and 90 percent but ever truly recover. Are there characteristics that helps with a stocks recovery? For instance, are large cap stocks more likely to recover? Is the recovery better for tech than say industrial? It'd be great to dig deeper to see if there are any variables we should be looking for that would improve the odds of recovery.