

What happens if you only invest in the best-performing asset?
20 years of data on hot hand fallacy

Last week, we covered how asset allocation is the most important decision for an investor. Many of you replied, asking us which asset class is the best and how they have performed. Our search led to some interesting results:
If you actively follow a sport, you will have experienced the hot-hand fallacy. It’s the mistaken belief that a person who has experienced success in a random event, such as successfully shooting a series of basketball shots, has a higher chance of success in the following shot. Even though most of us have “experienced” it and desperately believe it to be true, the famous 1985 study The Hot Hand in Basketball: On the Misperception of Random Sequences found that outcomes of consecutive basketball shots are independent.
Nowhere is the hot-hand fallacy more damaging than in investing. It’s common for investors to chase after fund managers after the fund has gone up 100% (ARKK) or once the stock has tripled in a month (GME) — we all know how that goes for the investors.
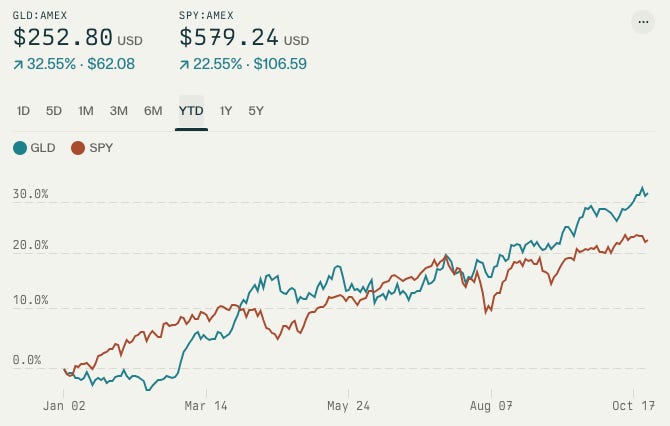
That brings us to what’s happening with Gold. Gold has had an extraordinary year by any measure — It is up 32% in 2024 and has even outperformed the S&P 500, which had its best year since 1999!
As expected, both retail and professional investors are piling into gold, given its recent performance. While gold certainly has excellent diversification benefits, the current rally and demand are mainly driven by its short-term performance.
If you did, congratulations! It looks like your investment would have paid off pretty well — Gold is up 52% since our last deep-dive into gold.
But when it comes to storing value and protecting against hard times, gold has a solid history of acting as a hedge, and it’s a good idea to have at least a small portion of your portfolio in gold — All that glitters
But this also implies that many of us buy into a high-performing asset due to recency bias. We wanted to take this to the extreme and see what would have happened if we invested only in the best-performing asset from last year.
Asset Quilt
Before we jump into the results, let’s see how the most popular asset classes have performed over the last 20 years. We have split the data into two decades: An interesting challenge for you would be to find some sort of repeating trend (FWIW, we tried for a few hours and gave up — The closest we could find was good old mean reversion).
2004 to 2013 | Real Estate Boom & Global Financial Crisis
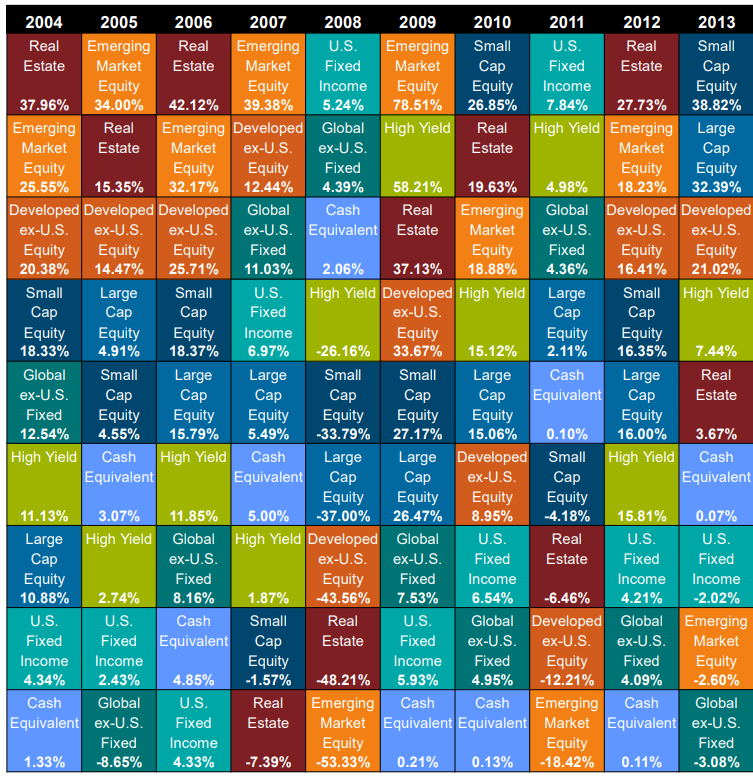
The performance of real estate in the years leading up to the global financial crisis was incredible. Real estate was up 38% in 2004, followed by 15% in 2005 and a whopping 42% in 2006 (basically, your home value just doubled in 3 years). What followed was a 7% drop in 2007 and a brutal 48% drop in 2008.
Another interesting trend was how emerging markets and U.S. large caps performed. Only once from 2004 to 2013 did the U.S. large-caps even make it to the top-3 performing assets. In comparison, emerging market performance was so strong that it was present in the top 3 in 7 out of 10 years.
2014 to 2023 | Rise of Big Tech
Remember Large Cap’s mediocre performance in 2004 - 2013? That got flipped on its head, and in the subsequent decade, in 8 out of 10 years, Large Caps were in the top 3 top-performing assets. In contrast, emerging markets languished in the bottom half of the asset quilt throughout the last decade.
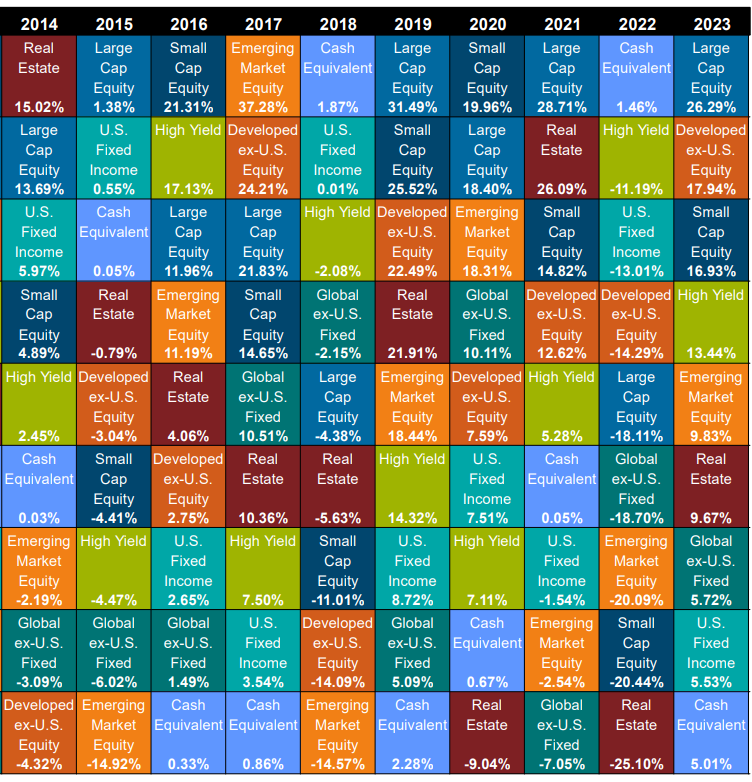
2023 was also arguably the best year in the last 2 decades, with the lowest return being that of cash at 5%.
What if?
While we know the yearly returns of each asset class, what’s more interesting to know would be:
What if you invested only in the best-performing asset class of the previous year? What about investing in the worst-performing asset?
Which asset class gave you the best and worst returns for buy and hold strategy over the last 2 decades?
Let’s dig in: